


 Invest ideas
News
19 May 2026, 12:40
Crypto-Linked Leveraged ETFs Among 20+ Funds Delisted in April, Most Lasting Under a Year

BitcoinWorld Crypto-Linked Leveraged ETFs Among 20+ Funds Delisted in April, Most Lasting Under a Year More than 20 leveraged and inverse exchange-traded funds (ETFs) were delisted in April, with a significant number failing to survive even a full year on the market, according to data shared by Bloomberg ETF analyst Eric Balchunas on social media platform X. Short Lifespans for Crypto-Focused Products Among the closures were several cryptocurrency-related products that launched with considerable fanfare but struggled to attract sustained investor interest. Direxion’s 2x Long Crypto Industry ETF, trading under the ticker LMBO, was delisted after just 0.68 years on the market. Its counterpart, the 1x Short Crypto Industry ETF (REKT), lasted only 0.67 years. Both products were designed to provide amplified exposure to the volatile digital asset sector, but apparently failed to generate the trading volume or asset base necessary for viability. Tidal Investments’ Altseason 2x ETF (QXAS), which aimed to capture gains during periods of altcoin outperformance, was also shut down after 0.96 years — just shy of its first anniversary. Hybrid products that combined traditional stock indices with Bitcoin exposure, such as the S&P 500 + Bitcoin ETF (OOSB) and the Nasdaq 100 + Bitcoin ETF (OOQB), similarly closed within approximately one year of their respective launches. Industry Pattern of Rapid Withdrawal Balchunas noted that asset managers are quick to withdraw these products once they identify a clear lack of demand. Rather than allowing funds to languish with minimal assets, firms appear to prioritize capital efficiency and product portfolio hygiene. The analyst also pointed out that the number of newly launched 2x leveraged ETFs each month continues to far exceed the number of closures, suggesting that while many fail, the industry remains committed to innovating in this space. What This Means for Investors The rapid delisting of these funds underscores the inherent risks associated with leveraged and inverse ETFs, particularly those tied to niche or highly volatile sectors like cryptocurrency. These products are designed for short-term trading strategies and carry significant complexity, including daily rebalancing and compounding effects that can lead to unexpected losses over extended holding periods. The closures serve as a reminder that even professionally managed products can fail if they do not achieve sufficient scale or market fit. Conclusion The wave of delistings in April, especially among crypto-linked leveraged ETFs, highlights the challenges asset managers face in maintaining products that depend on consistent trading volume and investor appetite. While the market for such instruments remains active, the data suggests that many new entrants will not survive their first year. Investors should carefully evaluate the liquidity, costs, and strategic purpose of any leveraged or inverse ETF before committing capital. FAQs Q1: Why were so many leveraged ETFs delisted in April? Asset managers typically delist ETFs that fail to attract sufficient assets under management or trading volume. In April, over 20 leveraged and inverse ETFs were closed because they did not generate enough investor demand to remain economically viable. Q2: Are crypto leveraged ETFs riskier than traditional leveraged ETFs? Yes. Crypto leveraged ETFs combine the amplified risk of leverage with the high volatility of digital assets. This can result in faster and larger losses, especially if held for more than a single trading day. Their short lifespans also indicate limited market acceptance. Q3: Should I invest in a newly launched leveraged ETF? Caution is advised. Many new leveraged ETFs, especially those tied to niche sectors, are delisted within a year. Investors should review the fund’s prospectus, understand its rebalancing mechanics, and consider whether the product aligns with their risk tolerance and investment horizon. This post Crypto-Linked Leveraged ETFs Among 20+ Funds Delisted in April, Most Lasting Under a Year first appeared on BitcoinWorld .
19 May 2026, 12:37
ETH price drops 40 percent as key developers leave

🚨 ETH price drops 40 percent to $2,117.02 as developer exits shake $ETH. Six core contributors have recently left the Ethereum Foundation. Continue Reading: ETH price drops 40 percent as key developers leave The post ETH price drops 40 percent as key developers leave appeared first on COINTURK NEWS .
19 May 2026, 12:36
Bitcoin Price Prediction: Bitcoin Holds Crucial $75K Area as Bulls Target $90K

Bitcoin is retesting the breakout zone from its W-pattern, with the $75,800-$76,800 area now acting as the key support range. At the same time, BTC remains above major moving averages, keeping the $90,000 upside setup active as long as support holds. Bitcoin Price Retests W-Pattern Breakout as $90K Target Stays in Play Bitcoin is retesting the W-pattern breakout zone from above on the daily chart shared by Man of Bitcoin on X. The BTC/USD chart shows price trading near $76,973, close to the horizontal breakout area around $75,811. This level now acts as the main support after Bitcoin recovered from the March-April W-pattern structure. BTC/USD Daily Price Chart. Source: Man of Bitcoin on X The chart shows Bitcoin first dropped below the zone in February, then formed two rounded lows near the $64,000-$67,000 area. After that, BTC climbed back above the neckline and pushed toward the $82,000 area. Now, Bitcoin has pulled back to test the same neckline from above. This type of retest often decides whether the breakout can continue or fail. If BTC holds above the $75,811 area, the W-pattern setup remains active. In that case, the next upside target sits near the green resistance line around $97,835, while Man of Bitcoin pointed to a possible move toward $90,000+. However, a daily close below the breakout level would weaken the setup. It would show that Bitcoin failed to hold the neckline as support after the breakout. For now, Bitcoin is at a key decision point. The chart supports another upside leg only if BTC holds the retest zone and avoids a breakdown back below the W-pattern neckline. Bitcoin Pullback Stays Orderly as BTC Holds Key Moving Average Support Bitcoin is still holding a key moving average support zone on the daily chart shared by Super฿ro on X, keeping the pullback controlled for now. The BTC/USD chart shows Bitcoin trading near $76,769 after pulling back from the recent high area above $82,000. However, price remains close to the 50-day EMA and 100-day EMA confluence, which the analyst marked on the left chart. BTC/USD Daily EMA and SMA Chart. Source: Super฿ro on X The EMA chart shows the 50 EMA near $76,725 and the 100 EMA near $76,854. BTC closed above that zone, which means buyers are still defending the short-term trend structure. The SMA chart on the right gives another support view. Bitcoin is trading above the 100-day SMA near $75,841, while the 2025 low area sits around the same support band. This makes the $75,800-$76,800 area important. As long as BTC holds this range, the pullback looks like a normal retest after the recent rally. However, a daily close below the 100 SMA and the 2025 low area would weaken the setup. It would show that Bitcoin lost the moving average support that has helped protect the recovery. For now, the chart does not show a breakdown. It shows Bitcoin testing support while staying above the main moving average zone.
19 May 2026, 12:35
$100/Month in Bitcoin Since 2015 Would Have Turned $13,700 Into $632,000, Coinbird Analysis Shows

Nuremberg, Germany, May 19th, 2026, Chainwire Based on Coinbird DCA Calculator data: monthly Bitcoin buying since 2015 returned +4,515%, while investors would still have endured a 76.72% drawdown, and DCA underperformed lump-sum investing in Coinbird's tested shorter-term scenarios New analysis from independent crypto comparison platform Coinbird shows what disciplined monthly Bitcoin buying since 2015 would have actually produced, while also showing where the popular narrative of “just DCA into Bitcoin” oversimplifies the reality. The findings are based on Coinbird’s Bitcoin DCA Calculator, which uses historical Bitcoin price data from CoinGecko and lets users model recurring investment scenarios going back to 2013. To run the backtest or explore alternative scenarios, users can visit: https://www.coinbird.com/cryptocurrencies/bitcoin/dca-calculator Key findings An investor who began a $100/month Bitcoin DCA plan in January 2015 would have made 137 monthly purchases through May 2026, investing a total of $13,700. As of May 19, 2026, the resulting portfolio of 8.219 BTC would be worth approximately $632,315, representing a total return of +4,515% on invested capital. The strategy accumulated Bitcoin at an average acquisition cost of roughly $1,667 per BTC, because early purchases acquired significantly more Bitcoin before prices rose. For investors who started later, near the May 2021 market peak before the 2022 crash, a $100/month DCA plan still returned +84.34% in the May 2021–May 2026 scenario — turning $6,100 invested across 61 monthly purchases into approximately $11,244. Over the same period, a lump-sum investment of the full amount made upfront in May 2021 returned approximately +43%. In this specific scenario, DCA outperformed because the strategy automatically accumulated more Bitcoin during the 2022 bear market. Importantly, lump-sum investing beat DCA at the 1-, 2-, 3- and 4-year horizons in Coinbird’s tested scenarios. The five-year DCA advantage emerged only after a full crash-and-recovery cycle. The conclusion that “DCA beats lump-sum” is not universal — it depends heavily on start date and market regime. DCA investors across the full period still experienced a maximum drawdown of -76.72% during the 2022 bear market, underscoring that recurring purchases do not eliminate volatility or the psychological difficulty of holding through severe declines. “The interesting finding is not simply that Bitcoin went up since 2015,” said Philipp, Founder of Coinbird. “The interesting finding is that, in this historical scenario, automatic monthly buying through crashes, all-time highs and regulatory uncertainty still produced extraordinary long-term results. At the same time, the drawdowns show why this strategy is much harder to live through than it looks on a chart in hindsight.” Coinbird’s Bitcoin DCA Calculator is available free of charge and allows users to test different investment amounts, purchase intervals and start dates going back to 2013. Methodology The analysis simulates recurring Bitcoin purchases at the selected monthly interval using historical CoinGecko price data. Lump-sum comparisons assume the full planned contribution amount is invested upfront at the start of the selected period. Calculations exclude taxes and trading fees. Past performance does not guarantee future results. About Coinbird Coinbird is an independent crypto comparison and market intelligence platform helping retail investors compare cryptocurrencies, exchanges and wallets with clearer data. On coinbird.com , users can explore live market data, compare providers, use crypto calculators and follow market indicators such as the Bitcoin Rainbow Chart, Bitcoin Dominance and Altcoin Season Index. Coinbird is operated by Coinbird GmbH and is the international platform of kryptovergleich.de , one of Germany’s leading crypto comparison portals, serving more than two million users annually. Across both platforms, Coinbird combines transparent data, practical tools and educational guides for new and experienced crypto investors alike. ContactFounderPhilipp DuringerCoinbird [email protected] Disclaimer: This is a sponsored press release and is for informational purposes only. It does not reflect the views of Crypto Daily, nor is it intended to be used as legal, tax, investment, or financial advice.
19 May 2026, 12:32
Ethereum Lags Bitcoin 10% as DeFi TVL Sheds $43B and Bearish Pattern Forms
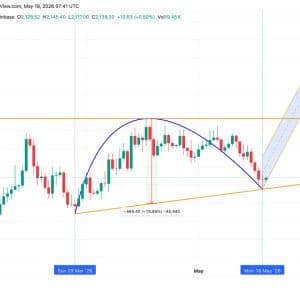
Ethereum News Ethereum is showing pronounced relative weakness against Bitcoin as the second-largest cryptocurrency stalls near $2,140, lagging the broader market by roughly 10% over the past month...
19 May 2026, 12:32
Ethereum Price Prediction: Is Sub-$2K Inevitable for ETH After Losing the 100-Day MA?
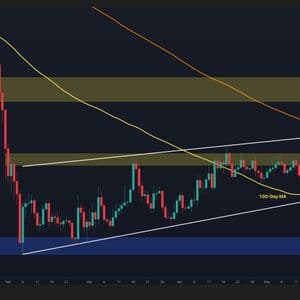
Ethereum remains under persistent selling pressure after failing to reclaim key resistance zones, with recent price action pointing to weakening bullish momentum and a growing probability of deeper retracement. The market is now testing critical support levels that could determine ETH’s next major move. Ethereum Price Analysis: The Daily Chart Ethereum has extended its corrective phase after repeated failures to sustain momentum above the $2.3K–$2.4K resistance region. The asset recently lost the 100-day moving average near $2.15K and is now hovering around the lower boundary of the broader ascending channel at the $2K area, signaling increasing bearish dominance in the medium term. This rejection suggests that sellers remain active during every recovery attempt. If ETH fails to defend the current channel support, a sharper decline toward the major demand region around $1.8K becomes increasingly likely. On the upside, reclaiming the $2.4K resistance would be required before considering any meaningful shift in sentiment. Until then, the broader structure favors continued consolidation or downside pressure. ETH/USDT 4-Hour Chart On lower timeframes, Ethereum has confirmed a bearish breakdown below the ascending wedge structure that had contained the price action for several weeks. Following the breakdown, ETH attempted a recovery toward the lost trendline but faced immediate rejection, validating the breakout and reinforcing bearish continuation scenarios. The recent selloff has now pushed the price toward a key support zone around $2.1K, where short-term buyers are attempting to stabilize the market. This region aligns with a notable demand block and the lower boundary of the broader rising channel, making it an important level to monitor. If this support fails, the next downside target could emerge around the $2K-$2.05K area. Conversely, holding above current levels may trigger a temporary rebound, though significant resistance remains overhead near $2.2K and later $2.4K. Sentiment Analysis The 3-month liquidation heatmap reveals a substantial concentration of liquidity resting above the current price, particularly around the $2.45K-$2.5K region. Historically, markets tend to gravitate toward large liquidation pools as they provide fuel for volatility and position unwinding. However, in the short term, Ethereum has begun tapping liquidity pockets below current levels near $2.05K-$2.1K while bearish momentum remains dominant. This suggests downside pressure could persist before any larger recovery attempt toward upper liquidity clusters occurs. The imbalance between nearby downside liquidity and heavier long-term clusters overhead points to elevated volatility ahead. Whether ETH first sweeps lower support zones or stages a recovery toward $2.5K will likely depend on how price reacts around the current $2.1K demand area. The post Ethereum Price Prediction: Is Sub-$2K Inevitable for ETH After Losing the 100-Day MA? appeared first on CryptoPotato .

