


News
23 Mar 2026, 07:11
XRP Slips Below $1.40 as Sellers Tighten Their Grip

XRP dropped below $1.40, signaling increased selling pressure and short-term market weakness. Critical support lies between $1.38 and $1.40; a breakdown may trigger sharper losses. Continue Reading: XRP Slips Below $1.40 as Sellers Tighten Their Grip The post XRP Slips Below $1.40 as Sellers Tighten Their Grip appeared first on COINTURK NEWS .
23 Mar 2026, 07:10
Hedera (HBAR) Price Prediction 2026-2030: The Critical Path to a $0.5 Milestone

BitcoinWorld Hedera (HBAR) Price Prediction 2026-2030: The Critical Path to a $0.5 Milestone As the cryptocurrency market continues its evolution into 2025, Hedera (HBAR) stands out with its unique hashgraph consensus mechanism and enterprise-focused roadmap. Consequently, investors and analysts are scrutinizing its potential trajectory toward the $0.5 threshold between 2026 and 2030. This analysis examines the fundamental drivers, market dynamics, and technological milestones that could influence HBAR’s price in the coming years. Hedera (HBAR) Price Prediction: Analyzing the 2026 Landscape Projecting HBAR’s price for 2026 requires a multi-faceted approach. First, analysts must consider the broader macroeconomic environment. For instance, potential interest rate adjustments and regulatory clarity will significantly impact all digital assets. Furthermore, Hedera’s own governance council, which includes companies like Google, IBM, and Deutsche Telekom, plays a crucial role. Their continued development and deployment of enterprise applications on the network directly affect HBAR’s utility and demand. Network metrics, such as average transaction volume and the number of active accounts, provide tangible evidence of adoption. Therefore, a realistic 2026 prediction hinges on the successful execution of Hedera’s technical roadmap and sustained growth in real-world use cases beyond speculative trading. Technical Foundations and Network Performance Hedera’s technical architecture differentiates it from traditional blockchains. The hashgraph consensus algorithm offers high throughput, low fees, and finality in seconds. These features are critical for enterprise adoption. Currently, the network consistently processes thousands of transactions per second (TPS) with minimal energy consumption compared to proof-of-work systems. Moreover, the stability of the network and its resistance to attacks are proven strengths. Upcoming protocol upgrades, as outlined in public council meetings, aim to enhance smart contract capabilities and interoperability. Such improvements could unlock new decentralized finance (DeFi) and tokenization projects, thereby increasing the intrinsic demand for HBAR tokens to pay for network services and staking. Expert Perspectives on Adoption and Valuation Financial analysts often reference the network value to transactions (NVT) ratio when assessing cryptocurrencies. For Hedera, a decreasing NVT ratio alongside rising transaction volume would signal healthy, utility-driven growth. Industry reports from firms like Gartner highlight the growing corporate interest in distributed ledger technology for supply chain, payments, and identity management. Hedera is frequently cited in these reports due to its governance model and performance. However, experts caution that price predictions are inherently probabilistic. They emphasize monitoring quarterly treasury reports from the Hedera Council, which detail HBAR release schedules and ecosystem funding. These releases influence circulating supply, a key variable in any price model. The Road to 2030: Long-Term Drivers and Potential Scenarios Looking toward the end of the decade, several long-term drivers will determine if HBAR can sustain a price above $0.5. The integration of central bank digital currencies (CBDCs) and large-scale asset tokenization presents a significant opportunity. Hedera’s regulatory-friendly design positions it as a potential infrastructure layer for these initiatives. Additionally, the expansion of the Hedera Token Service and the maturation of its decentralized autonomous organization (DAO) tools could foster a more vibrant developer ecosystem. Conversely, challenges include intense competition from other layer-1 networks and the unpredictable nature of global financial markets. A balanced 2030 outlook must weigh these transformative potentials against execution risks and market cycles. Key HBAR Price Influencing Factors (2026-2030) Factor Potential Positive Impact Potential Negative Impact Enterprise Adoption Increased transaction volume & locked value Slow rollout of promised use cases Regulatory Climate Clarity boosting institutional investment Restrictive policies hindering growth Network Upgrades Enhanced functionality attracting developers Technical delays or vulnerabilities Macroeconomic Conditions Favorable risk-on investor sentiment Recession reducing capital inflow Market history shows that cryptocurrency prices are volatile. Past performance does not guarantee future results. Investors should conduct their own research and consider their risk tolerance. The data presented here is for informational purposes only and is not financial advice. Conclusion In summary, the path for Hedera (HBAR) to reach $0.5 between 2026 and 2030 is complex and dependent on interconnected factors. Achieving this milestone will require consistent growth in network utility, successful navigation of the regulatory landscape, and the continued commitment of its governing council. While the technological foundation is robust, real-world adoption remains the critical variable. Ultimately, monitoring quarterly ecosystem development reports and on-chain metrics will provide the clearest signals of HBAR’s long-term price trajectory. FAQs Q1: What is the main use case for the HBAR token? The HBAR token has two primary functions: it is used to pay for transaction fees and network services on the Hedera platform, and it is staked to help secure the network through proof-of-stake consensus. Q2: How does Hedera’s governance differ from other cryptocurrencies? Hedera is governed by a council of up to 39 diverse and leading organizations from various industries. This governing body oversees software updates, network policies, and treasury management, aiming for decentralized governance without concentrating power with founders or miners. Q3: What are the biggest risks to HBAR’s price growth? Key risks include slower-than-expected enterprise adoption, increased competition from other blockchain platforms, adverse global cryptocurrency regulations, and broader financial market downturns that reduce investment in digital assets. Q4: How does Hedera’s energy consumption compare to Bitcoin or Ethereum? Hedera’s hashgraph consensus mechanism is extremely energy-efficient, as it does not rely on the intensive computational mining used by proof-of-work systems. The network claims to be carbon-negative through partnerships and offsets. Q5: Where can I find reliable data on Hedera’s network activity? Official metrics are published on Hedera’s website and dashboard. Independent blockchain explorers like DragonGlass also provide real-time data on transactions, accounts, and network performance for transparency. This post Hedera (HBAR) Price Prediction 2026-2030: The Critical Path to a $0.5 Milestone first appeared on BitcoinWorld .
23 Mar 2026, 07:03
Solana fails $90 again: will $85 be the next level to crack?
Solana is trading under pressure at the start of the week, struggling to regain momentum after failing to hold above key resistance levels. The token is currently trading at $86.55, down 1.91% in the last 24 hours and nearly 7% over the past week. Source: CoinMarketCap Weak technical signals, declining derivatives activity, and rising geopolitical tensions are combining to keep sentiment cautious, limiting the scope for a near-term recovery in SOL. Price holds below resistance Solana’s recent attempt to push above $92 failed to sustain, triggering a fresh wave of selling. The price slipped below the $90 and $88 levels, accelerating losses as it dropped under $87.20 and formed a low near $85.10. SOL is now consolidating below the 23.6% Fibonacci retracement level of the move from $90.81 to $85.10. It is also trading beneath the 100-hour simple moving average, reflecting continued short-term weakness. On the upside, resistance is building near $88, reinforced by a bearish trend line on the hourly chart. The next barrier stands at $88.60, followed by the key $90 zone. A decisive move above $90 could shift momentum and open the path toward $95 and $102. Downside pressure builds If Solana fails to reclaim the $88 resistance, further downside remains likely. Initial support sits at $85, with stronger levels at $82 and $80. A break below $82 could push the price toward $80, while a close under that level may expose $74 in the near term. This would reinforce the broader downward structure that has emerged over recent sessions. Momentum indicators support this cautious stance. The hourly MACD is strengthening in bearish territory, while the RSI remains below 50, indicating weak buying pressure and limited upside momentum. Geopolitical tensions hit crypto sentiment Crypto markets are starting the week on a softer note as tensions in the Middle East intensify. Concerns around a potential escalation involving the US and Iran have weighed on risk appetite. On Monday, US President Donald Trump posted on Truth Social , “PEACE THROUGH STRENGTH, TO PUT IT MILDLY!!!” The statement followed Iran’s warning that it could target energy and water infrastructure in Gulf nations if threats to strike its electricity grid are carried out. This backdrop has pressured digital assets, with Bitcoin closing below $67,360 on Sunday and triggering broader liquidations. Solana followed the trend, slipping below $87 and continuing to trade cautiously. Weak derivatives activity signals caution Market participation in Solana derivatives has been declining, reinforcing the bearish tone. Futures Open Interest on Binance fell to $871.40 million on Monday and has been trending lower since mid-January, signalling reduced trader engagement. Funding rates have also turned negative at -0.0011%, indicating that short positions are paying longs and reflecting bearish positioning in the market. Despite this, institutional demand has remained resilient. Data showed $21.10 million in inflows into Solana products last week, marking six consecutive weeks of positive flows. However, any reversal in these inflows could add further downside pressure. On the daily chart, the RSI stands near 46, suggesting neutral momentum, while the MACD has slipped below the signal line and is approaching zero. This indicates fading bullish strength after the price failed to break above the descending trendline near $91.44. The post Solana fails $90 again: will $85 be the next level to crack? appeared first on Invezz
23 Mar 2026, 07:01
CAKE Technical Analysis 23 March 2026: Market Structure

CAKE is showing LH/LL structure in the downtrend, BOS above $1.3994 is a bullish reversal signal. Breakdown below $1.3432 opens bearish target $0.8684, BTC correlation increases downside risk.
23 Mar 2026, 07:01
Rising US Bond Yields Weigh on Equities After Bitcoin’s Sharp Decline

Bitcoin’s early-year drop preceded widespread weakness in equities and other risk assets. Surging US bond yields have made borrowing costlier, pressuring stock markets lower. Continue Reading: Rising US Bond Yields Weigh on Equities After Bitcoin’s Sharp Decline The post Rising US Bond Yields Weigh on Equities After Bitcoin’s Sharp Decline appeared first on COINTURK NEWS .
23 Mar 2026, 07:00
Bitcoin Hits Two-Week Low as War Tensions Fan Uncertainty
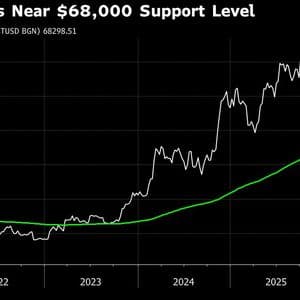
Bitcoin fluctuated near a two-week low on Monday, sliding in early Asia trading before rebounding to a key support level amid escalating tensions in the Middle East.


