


 Invest ideas
News
3 Jun 2026, 10:41
Bitcoin steadies at $67,000, faces critical juncture after sliding 9.5% in seven days
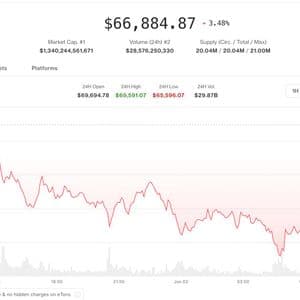
The recovery does little to mask a 9.5% weekly decline as U.S. stocks hit records highs, AI tokens rally and Coinbase's Ethena deal steals the spotlight.
3 Jun 2026, 10:37
Dogecoin Price Prediction: Can DOGE Hold $0.09 Before a Deeper Drop?

Dogecoin is testing the $0.09 support zone after a sharp daily decline. At the same time, a long-term chart keeps the $10 target alive if DOGE holds its multi-year trend. Dogecoin Price Tests Key $0.09 Support as Selling Pressure Intensifies Dogecoin fell more than 7% on the daily chart and closed near $0.0938, putting the meme coin directly above the $0.09 support zone highlighted by analyst KrissPax. Dogecoin 9 Cent Support. Source: TradingView / KrissPax on X The chart shows DOGE breaking below a short-term consolidation range around $0.10-$0.102. A large bearish candle accompanied the decline, suggesting sellers remain in control. Volume also increased during the move, indicating stronger participation in the sell-off. The $0.09 level stands out as the next major support. DOGE traded around that area in early April before starting a rally that later pushed the token above $0.11. As a result, traders may view this zone as an important test of market demand. On the upside, DOGE would need to reclaim $0.10 and then $0.102-$0.105 to reduce immediate downside pressure. However, the current chart structure shows lower highs and lower lows, which remains consistent with a short-term downtrend. If the $0.09 support fails to hold, the next downside area appears near $0.087-$0.088, based on previous swing lows visible on the chart. Conversely, a successful defense of $0.09 could trigger a relief bounce as buyers attempt to regain control. Dogecoin $10 Prediction Relies on Long-Term Channel Support A chart shared by Vuori Trading suggests Dogecoin remains inside a multi-year ascending channel that has guided price action since 2014. The analyst argues that DOGE continues to follow a recurring pattern of accumulation, breakout, pullback, and expansion phases. Dogecoin Weekly Ascending Channel Analysis. Source: Vuori Trading on X / TradingView The chart marks five major cycle waves, labeled I through V. Previous bull runs began after DOGE retested the lower boundary of the channel, highlighted by blue circles. Each retest was followed by a sharp upward move toward the middle or upper portion of the trend channel. According to the analysis, DOGE is currently revisiting channel support near the lower trendline. The setup resembles previous cycle lows seen before the 2017 and 2021 rallies. The chart also highlights a Relative Strength Index (RSI) reading near the historical buy zone, where earlier market bottoms formed. Vuori Trading projects that a successful defense of current support could start the next major advance, labeled Wave V. The analyst's upper-channel target points to a potential move above $10, although that scenario depends on DOGE maintaining its long-term trend structure and repeating previous market cycles.
3 Jun 2026, 10:36
Top economist outlines Bitcoin’s path to $20,000

Economist and strategist Peter Schiff took Bitcoin’s ( BTC ) latest plunge to both reiterate his long-standing $20,000 price target for the cryptocurrency and to briefly outline the asset’s downward path. Specifically, Schiff estimates that BTC has more room to fall after retracing 11.40% to $67,164 in the last week of trading, as ‘here is way too much complacency in Bitcoin for the market to be anywhere near a bottom.’ The X post implies the economist believes Bitcoin’s latest trajectory will take the cryptocurrency to and below $50,000, which is likely to prove a sufficient downward catalyst to rapidly reach $20,000. Schiff speculated that such a crash could cause long-term holders and bulls ‘to finally throw in the towel,’ as their conviction breaks. Does Schiff believe Bitcoin crash could trigger market-wide contagion? In a separate yet related social media post , the economist also wondered if the latest moves in the cryptocurrency market would remain confined to the industry or lead to contagion across other risk assets, possibly turning into ‘a catalyst to drive investors into value and safety.’ I wonder if a Bitcoin crash will be a harbinger of things to come in risk assets in general, or if it's just a one-off thing confined to Bitcoin and crypto. Whichever it is, we should find out soon enough. Maybe it will also be a catalyst to drive investors into value and safety. — Peter Schiff (@PeterSchiff) June 2, 2026 Given Peter Schiff’s track record, ‘value and safety’ likely primarily refers to gold , and he, on June 2, unfavorably compared Bitcoin’s performance between 2021 and 2026 to the returns from other investments, including the yellow metal, silver , and stocks : Bitcoin is below $69K, a peak first reached in Nov. 2021, nearly five years ago. However, during that time period the NASDAQ is up 73%, gold is up 138%, and silver is up 218%. Despite the unprecedented hype, Bitcoin investors missed out on huge gains in risk and safe-haven assets. Why is Bitcoin price falling? Elsewhere, it appears that Bitcoin’s most recent plunge is a direct result of Michael Saylor’s Strategy (NASDAQ: MSTR ) selling some of its BTC for the first time since 2022 to cover its rising costs on other fronts. For his part, the billionaire HODLer maintains his company has enough money to hold the world’s premier cryptocurrency indefinitely and regardless of market moves. Another potential candidate for the risk-off sentiment among digital asset investors – and likely a supporting factor in the sell-off – is the recent rise in tension in the Middle East. Despite numerous reports of a deal between the U.S. and Iran being ‘imminent,’ negotiations remain seemingly frozen, and the two countries have been increasingly exchanging blows . If the geopolitical situation proves the more decisive factor than Saylor’s traders, Schiff’s speculation that Bitcoin might be a harbinger of a wider move among risk assets could prove correct. The Strait of Hormuz remains effectively closed, and Exxon Mobil (NYSE: XOM ) recently warned that oil inventories are approaching crisis levels. Featured image via Shutterstock The post Top economist outlines Bitcoin’s path to $20,000 appeared first on Finbold .
3 Jun 2026, 10:31
Solana Price Prediction: Is SOL Headed Toward $27 After Losing $77 Support?
Solana has slipped below the key $75-$77 support zone after on-chain data showed thin demand under that level. The breakdown now puts lower SOL support areas near $53, $35, and $27 in focus. Solana Faces Critical $77 Support as On-Chain Data Reveals Thin Demand Below Solana's UTXO Realized Price Distribution (URPD) data shows a major concentration of investor holdings around the $77-$83 range, making it one of the most important support zones on the chart, according to analyst Ali Charts. Solana URPD Analysis. Source: Glassnode / Ali Charts on X The chart highlights large clusters of realized supply at $82.60 and $85.55, indicating that many SOL holders acquired their tokens near those levels. Another significant concentration appears around $79.65, reinforcing the broader support area near $77-$80. According to Ali Charts, this distribution makes $77 a critical level for Solana. As long as price remains above it, the largest group of holders stays near breakeven or in profit. However, the chart shows relatively little realized supply between $77 and lower price levels. This lack of demand concentration suggests there may be fewer support zones immediately below the current market. If SOL loses the $77 level, the next major areas of interest appear near $53.10, $35.40, and $23.60, where larger clusters of historical buying activity are visible. These levels represent zones where previous investors accumulated substantial amounts of SOL and could potentially provide support. The URPD model tracks where existing coins last moved on-chain, helping analysts identify price levels with significant holder concentration. In Solana's case, the data indicates that the $77-$83 region remains the key support area to watch. Solana Chart Warns of Deeper Drop as $75 Support Breaks Solana fell to around $73.77 on the weekly chart, slipping below the $75-$77 support area marked in earlier analysis. The chart shared by EllioTrades shows a downside projection toward the $27-$28 zone if SOL fails to reclaim the broken support. Solana Weekly Breakdown Setup. Source: EllioTrades on X / TradingView The chart marks nearby resistance around $83-$95, while the broken support area sits near $75.33-$75.36. SOL is now trading below that level, which weakens the short-term structure. The large downside box points to the next major lower zone near $27.29-$27.62. That area aligns with previous long-term support from earlier Solana cycles. For the bearish setup to weaken, SOL would need to reclaim $75-$77 first, then move back toward $83-$95. Until then, the chart keeps downside risk in focus.
3 Jun 2026, 10:30
Has An Alt Season Begun? Here’s What The Altcoin Season Index Says

Recently, there have been rallies across some altcoins, with Ethereum seeing some recovery as well, pushing the idea of an alt season. With the likes of Hyperliquid pumping to new all-time highs, this has propelled some of the top 100 altcoins by market cap to surpass Bitcoin’s performance during this time. As more altcoins continue to outperform , does this mean that another alt season has begun? This report takes a look at what the data says. Altcoin Season Index Sitting At A Score Of 36 The Altcoin Season Index has historically been the index that tells when the crypto market has entered an alt season . According to the index, it measures the performance of the top 100 altcoins against that of Bitcoin over a 90-day period and then plots this across a score of 1-100 to show when the market has entered into an alt season. Historically, the higher the score goes, the more the likelihood that the crypto market is experiencing an alt season. Usually, this means that the Bitcoin outperformance has stalled, and its dominance over the rest of the crypto market has dropped drastically. Presently, the Altcoin Season Index is reading at a score of 36, according to data from the Coinglass website. Also, the Bitcoin dominance began to recover again during the weekend, rising above 59.88% by the time Sunday rolls around. Naturally, neither of these bodes well for an alt season. Dissecting The Data For An Alt Season With the Altcoin Season Index sitting this low at 36, it means that the market is not actually experiencing an alt season . Usually, an alt season would begin with the score sitting above 75. This would mean that 75% of the top 100 altcoins are performing better than Bitcoin in a 3-month timeframe to make this happen. Additionally, the Bitcoin dominance over the crypto market has continued to rise instead of dropping. This is a sign that the market is actually not moving into an altcoin season. This would only happen when the Bitcoin dominance begins to crash , and the altcoin dominance starts to rise. Given the data, it suggests that the rallies of some altcoins are only spot rallies . Ethereum is also underperforming compared to Bitcoin during this time, and being the historical leader of the altcoin season, Ethereum would have to begin outperforming Bitcoin to trigger the next alt season.
3 Jun 2026, 10:30
Grayscale’s Hyperliquid Staking ETF Debuts With Lowest US Fee at 0.29%

Grayscale’s Hyperliquid Staking ETF (HYPG) began trading on June 3 with a 0.29% sponsor fee, the lowest among US-listed HYPE products, intensifying a price war among issuers chasing the fast-growing token. A Fee War Heats up Around HYPE Grayscale has launched its Hyperliquid Staking exchange-traded fund (ETF), with the product now trading live under the


