


 Invest ideas
News
2 Jun 2026, 16:15
Ethereum Dips Below $1,900 as Broader Crypto Market Faces Pressure

BitcoinWorld Ethereum Dips Below $1,900 as Broader Crypto Market Faces Pressure Ethereum (ETH) has slipped below the $1,900 threshold, extending its recent decline amid broader market headwinds. According to Bitcoin World market data, the second-largest cryptocurrency by market capitalization is currently trading at $1,897.2 on Binance, reflecting a 4.04% decrease over the latest session. Market Context and Recent Price Action The drop below $1,900 marks a notable psychological level for traders, as ETH had been consolidating near the $2,000 mark in recent weeks. The decline comes amid a broader pullback across the cryptocurrency market, with several major tokens experiencing similar downward pressure. Analysts point to a combination of factors, including profit-taking after a recent rally, uncertainty around macroeconomic conditions, and shifting sentiment in the digital asset space. Ethereum’s price movement is closely watched by investors as a bellwether for the altcoin market. The current level represents a retreat from highs seen earlier in the month, though the asset remains significantly above its lows from the previous quarter. Potential Triggers and Market Sentiment While no single catalyst has been identified for the latest move, market participants are monitoring several developments. These include regulatory discussions in major economies, fluctuations in trading volumes on centralized exchanges, and the ongoing evolution of Ethereum’s network activity, including layer-2 scaling solutions and DeFi ecosystem health. Trading volumes for ETH on Binance have seen a noticeable uptick during the decline, suggesting active participation from both retail and institutional traders. The 4.04% drop is within the range of normal daily volatility for the asset, but crossing below the $1,900 line has drawn attention from technical analysts who view it as a potential support level. Implications for Traders and Investors For short-term traders, the breach of $1,900 introduces a new set of technical considerations. Support levels around $1,850 and $1,800 may come into focus if selling pressure continues. Conversely, a rebound above $1,900 could signal that the market views this as a buying opportunity. Long-term holders, however, often view such pullbacks as part of normal market cycles, especially given Ethereum’s historical resilience and ongoing network upgrades. The broader cryptocurrency market’s correlation with traditional risk assets remains a factor. Equity markets have also shown signs of volatility, reinforcing the view that digital assets are increasingly integrated into global financial flows. Conclusion Ethereum’s dip below $1,900 is a significant but not unprecedented event in the current market environment. While short-term sentiment appears cautious, the asset’s fundamental developments and adoption trends continue to underpin its long-term narrative. Traders should monitor key support levels and broader market signals in the coming sessions. FAQs Q1: Why did Ethereum drop below $1,900? The decline appears driven by a combination of broader market pullback, profit-taking, and macroeconomic uncertainty. No single event has been identified as the primary trigger. Q2: Is this a good time to buy Ethereum? Investment decisions depend on individual risk tolerance and market outlook. The current price may represent an entry point for some, but volatility remains high. Consulting a financial advisor is recommended. Q3: What are the next key support levels for ETH? Technical analysts are watching $1,850 and $1,800 as potential support levels if selling pressure continues. A move back above $1,900 could signal renewed buying interest. This post Ethereum Dips Below $1,900 as Broader Crypto Market Faces Pressure first appeared on BitcoinWorld .
2 Jun 2026, 16:11
Bitcoin Price Falls To $67,000 And Breaks The Map For Bulls—Here’s What Happens Next

The Bitcoin price fell hard on Tuesday, hitting $67,289—its lowest level since April—reshaping sentiment toward a more bearish outlook as bulls lose key support zones. CoinGecko data shows the selloff isn’t isolated to one timeframe. Bitcoin has retraced across all-time horizons, reflecting widespread bearish sentiment and persistent selling pressure. The Bitcoin price is down about 6% over the last 24 hours and roughly 15% on the monthly timeframe. After the drop, Bitcoin is around 47% below its all-time highs of $126,000 set during last year’s rally. What’s Next For The Bitcoin Price? On X (previously Twitter), market analyst Ali Martinez argued that the Bitcoin price has broken below several major levels that traders typically use as a line in the sand. Martinez pointed to the loss of channel support, the loss of the 100-day simple moving average (SMA), and the move below the 0.5 Fibonacci retracement level around $71,300. Related Reading: Bullish Shift For TON: Price Breaks Above $2 Following Telegram CEO’s Gram News The analyst said that once all three were lost, the odds of downside acceleration rose sharply, pointing to $65,000 as the next likely move. From current levels, that potential retrace would mean an additional pullback of about 3.4%. BTC To $48,000 By September Market expert Nonzee claimed “history is repeating itself,” describing a bear-trap pattern that previously went from $97,000 to $83,000, and then the expert charted a continuation of the crash for the Bitcoin price with another leg: $65,000, then $61,000, $58,000, $55,000 and a potential bottom at around $48,000. Related Reading: Binance Unveils Trading Access To Over 7,000 US Stocks, ETFs—And Adds A New Tokenization Plan In that scenario, the “next stops,” according to Nonzee, include “$60,000 in days,” and $48,000 by September. Short Bitcoin price bounces may happen, but he argued that waiting for a full bull market right now would be a mistake. Not everyone is calling for the same exact path, but the tone across these forecasts is clearly cautious. Tony Research, for example, said he expects a bounce from $67,000 into the $74,000 area, yet the larger message remains that the main trend is still bearish. Featured image created with OpenArt; chart from TradingView.com
2 Jun 2026, 16:09
Bitcoin’s Inflation-Hedging Promise in Tatters After 36% Plunge
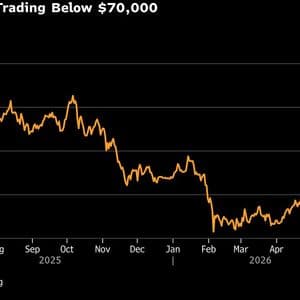
Bitcoin has fallen 36% over the past year and slipped below $70,000 this week, extending a retreat that is undermining several of the arguments that helped carry the cryptocurrency into the financial mainstream.
2 Jun 2026, 16:07
Polymarket faces backlash over disputed Strategy Bitcoin market

The controversy has reignited broader questions about governance and rule interpretation in crypto prediction markets.
2 Jun 2026, 16:05
Altcoins Gain $4B Despite Bitcoin Sell-Off, Analyst Sees Bullish Shift

On June 2, 2026, as Bitcoin (BTC) tumbled below $70,000, the total market capitalization of altcoins actually rose by $4 billion, according to crypto analyst Sykodelic. That unusual divergence suggests that there could be a potential breaking point where smaller tokens may stop bleeding in response to BTC’s weakness, a pattern that in the past was seen right before there were broader market recoveries. Altcoins Hold Ground as Bitcoin Falters Bitcoin’s price action only got worse over the past 24 hours, when, after failing to hold above $73,000, it dropped to an intraday low near $72,500 before sliding further to under $68,000 on Tuesday, marking a nearly 6% daily decline. The OG crypto is now down almost 11% for the week, according to CoinGecko, and risks falling back toward $65,000. Despite BTC’s poor form, altcoins told a different story. “What we are observing here is an exhausted market in which alts are no longer responding to weakness,” wrote Sykodelic on X. “Bitcoin is actually being weaker than OTHERS.” The analyst also noted that the total altcoin market cap went up by $4 billion on the day, while Bitcoin’s dominance dropped by 1%. As CryptoPotato reported yesterday, some tokens delivered sharp gains, including Humanity (H), which pumped by roughly 81%, LAB, which gained more than 52%, and Worldcoin (WLD), which added another 13% to its price and was trading at around $0.43 at the time of writing. In their analysis, Sykodelic also pointed to the business cycle index sitting at 54.0, a level that is historically associated with expansion, and noted that the OTHERS.D chart had closed above its 200-day simple moving average. He added that every time OTHERS.D reclaimed the 200 SMA, it jumped by at least 250%, which could offer traders a ray of hope, considering that the current setup, according to the market watcher, is quite similar to other bottoms in the past that preceded parabolic altcoin moves. Liquidity Debate and Market Outlook The current state of the market may temper Sykodelic’s optimism, with analysts comparing BTC’s performance to that of traditional equity markets, which have been soaring and hitting record highs while the king cryptocurrency faltered, leading to suggestions that most of crypto’s liquidity is flowing into stock markets. But fellow market watcher CrediBULL Crypto has dismissed such suggestions, pointing out that the total market capitalization of all tokens outside the top 10 coins is less than $200 billion, which is roughly “1/350th of the S&P 500.” He said there is hardly any liquidity flowing out of crypto, but there are hundreds of trillions of dollars in traditional markets that could potentially flow into BTC and alts. The post Altcoins Gain $4B Despite Bitcoin Sell-Off, Analyst Sees Bullish Shift appeared first on CryptoPotato .
2 Jun 2026, 16:05
Crypto Market Sees $254 Million in Futures Liquidations in One Hour as Volatility Spikes
BitcoinWorld Crypto Market Sees $254 Million in Futures Liquidations in One Hour as Volatility Spikes The cryptocurrency derivatives market experienced a sudden and sharp wave of liquidations in the past hour, with major exchanges reporting approximately $254 million worth of futures positions forcibly closed. This surge brings the total liquidations over the last 24 hours to $1.11 billion, according to aggregated exchange data. Breakdown of the Liquidation Event The liquidations have been concentrated across both long and short positions, reflecting a sudden shift in market sentiment. Data from leading derivatives platforms indicate that Bitcoin and Ethereum futures accounted for the majority of the liquidated value, though altcoin positions also contributed significantly. The speed of the liquidations suggests a rapid price movement that triggered cascading stop-losses and margin calls. Market participants point to a combination of factors, including a sudden sell-off in spot markets, thinning liquidity during certain trading hours, and leveraged positions being caught off guard by the velocity of the move. Such events are not uncommon in cryptocurrency markets, where high leverage is frequently used by traders. Context and Market Implications This liquidation event occurs against a backdrop of relatively low volatility in the broader crypto market over the past several weeks. The sudden spike serves as a reminder of the inherent risks in leveraged trading, particularly in an asset class known for its sharp price swings. For the market as a whole, large-scale liquidations can sometimes signal a short-term bottom or top, as forced selling or buying exhausts the immediate pressure. Exchanges typically benefit from such events through liquidation fees, but the impact on trader sentiment can be negative, especially for retail participants who may face significant losses. Institutional traders often view these moments as opportunities to re-enter positions at more favorable prices. What This Means for Traders For active futures traders, this event underscores the importance of risk management, including the use of appropriate leverage, stop-loss orders, and position sizing relative to account equity. The speed of the liquidations also highlights the need for monitoring market depth and order book dynamics, as liquidity can evaporate quickly during volatile periods. Conclusion The $254 million in hourly liquidations and $1.11 billion in 24-hour liquidations represent a significant but not unprecedented event in the cryptocurrency derivatives market. While the immediate impact on prices may be short-lived, the event serves as a useful data point for understanding current market leverage and sentiment. Traders and analysts will be watching for any follow-through volatility in the coming sessions. FAQs Q1: What causes a mass liquidation event in crypto futures? A mass liquidation event is typically triggered by a rapid price movement in the underlying asset. When the price moves sharply against leveraged positions, exchanges automatically close those positions to prevent further losses, which can cascade and amplify the price move. Q2: Are these liquidations a sign of a market crash? Not necessarily. While large liquidations can accompany sharp price drops, they can also occur during rapid upward movements that catch short sellers off guard. They are more indicative of high leverage in the market than a fundamental change in asset value. Q3: How do exchanges benefit from liquidations? Exchanges typically charge a liquidation fee, which is added to a shared insurance fund used to cover losses from positions that cannot be fully liquidated at the market price. This mechanism helps maintain the integrity of the derivatives market. This post Crypto Market Sees $254 Million in Futures Liquidations in One Hour as Volatility Spikes first appeared on BitcoinWorld .
