


 Invest ideas
News
29 May 2026, 17:30
Bitcoin Wyckoff Accumulation Is About To Do Something That No One Is Expecting

A crypto analyst is sounding the alarm that Bitcoin (BTC) is currently executing one of the most painful patterns in its entire market history. According to the expert, Bitcoin has formed a classic Wyckoff Accumulation pattern , a century-old market theory that describes how institutions and the wealthy secretly buy assets at low prices before a major rally. The analyst has projected that before any major upward price movement, this pattern could trigger a severe crash in the BTC price. Bitcoin Forms Painful Wyckoff Accumulation Pattern According to crypto market expert NoName, Bitcoin is currently at a critical stage, with its market structure flashing warning signs of a potential price crash . In a Monday, 26 X post, the analyst cautioned that Bitcoin is now running one of the most psychologically brutal setups in financial markets, and that most investors may not be ready for what comes next. NoName revealed that the emergence of the Wyckoff Accumulation suggests that large institutional players and whales may be deliberately keeping prices suppressed and chaotic. He said that the only purpose of this pattern is to shake out as many ordinary investors as possible before a major price rally. According to the analyst’s chart, Bitcoin has already completed the early stages of this painful pattern on the weekly chart. He declared that the Preliminary Support (PS), Selling Climax (SC), and Secondary Test (ST) have all been printed, meaning the foundation of the Wyckoff Accumulation structure is firmly in place. Already, the market is experiencing widespread selling pressure after recording a brief recovery in March and April. With the pattern now seemingly in place, NoName has called for one final Bitcoin price drop to $52,000 before the structure fully resets. This lower price point aligns with the Spring phase of the Wyckoff Accumulation theory, which signals a deliberate sharp move below support. This stage typically triggers stop losses, causes panic selling , and convinces the majority of investors and holders in the market that Bitcoin is heading much lower. Bitcoin Bottom Marked As Next Buying Opportunity NoName’s analysis suggests BTC’s potential decline toward the projected cycle bottom below $52,000 is where smart money would likely step in aggressively. Personally, he noted that this is likely where he would begin accumulating without hesitation, marking the area as a prime buying opportunity . The $52,000 bottom is also not seen as a complete price breakdown, but a short-term decline before the real Bitcoin move begins. If the full Wyckoff Accumulation structure plays out as mapped on the analyst’s chart, then the next move could easily take the BTC price through its Last Point of Support (LPS), marked around the $76,000 range. After this, the cryptocurrency is expected to enter the Sign of Strength (SOS) breakout phase, where its price could skyrocket toward $110,000.
29 May 2026, 17:30
Bitcoin ETFs Hit 9-Day Outflow Streak As Ethereum Funds Bleed For 13th Day

Spot Bitcoin ETFs extended their redemption streak on May 28, with another $229 million leaving the products as outflows across crypto-linked exchange-traded funds deepened. Spot Ethereum ETFs also remained under pressure, recording $121 million in net outflows and pushing their own withdrawal run to 13 consecutive trading days. Bitcoin ETFs See Ninth Straight Outflow The latest data from SoSoValue adds to a broader cooling in ETF demand after a period in which spot products became one of the market’s most closely watched liquidity channels. For Bitcoin funds, the May 28 outflow brought cumulative net inflows down to $55.79 billion, while total net assets stood at $94.25 billion. Daily trading volume across the spot Bitcoin ETF complex reached $2.36 billion. The nine-day Bitcoin ETF outflow streak has now removed about $2.84 billion from the products. The heaviest single-day redemption in the run came one session earlier, on May 27, when the funds lost $733.4 million. That followed a $333.7 million outflow on May 26 and a $648.6 million outflow on May 18, making the streak more than a minor one-day reversal. The last positive day before the current Bitcoin ETF sequence was May 14, when the products posted $131.3 million in net inflows. Since then, the data show a persistent shift toward redemptions, with every subsequent trading session through May 28 closing in negative territory. Total net assets have also fallen from $107.75 billion on May 14 to $94.25 billion on May 28, although that decline reflects both flows and underlying Bitcoin price movements. Ethereum ETF Streak Hits 13 Ethereum funds showed a similar, and proportionally sharper, pattern. Spot Ethereum ETFs saw $121.4 million in net outflows on May 28, bringing cumulative net inflows to $11.39 billion and total net assets to $11.30 billion. Daily trading volume stood at $691.3 million. The 13-day Ethereum ETF outflow streak has pulled roughly $694.6 million from the products since May 11. The largest daily loss in that sequence came on May 12, when the funds shed $130.6 million, followed by the May 28 outflow of $121.4 million. In percentage terms, the May 28 Ethereum ETF withdrawal was more pronounced than the Bitcoin ETF move, amounting to about 1.07% of total net assets, compared with roughly 0.24% for Bitcoin ETFs. The divergence in scale remains important. Bitcoin ETFs still hold far larger aggregate assets and maintain a much larger cumulative net inflow base, even after the recent redemption streak. Ethereum ETFs, by contrast, are operating from a smaller asset base, which makes nine-figure daily outflows more significant relative to the size of the market. The outflows came as macro conditions turned less favorable for non-yielding risk assets, with rising long-end Treasury yields pressuring expectations for Federal Reserve rate cuts and pushing investors toward a more defensive stance. At the same time, Bitcoin-specific support from major corporate buyers looked less forceful, with Strategy pausing fresh purchases after its preferred stock traded below par. At press time, BTC traded at $73,661.
29 May 2026, 17:24
NEAR price jumps 10% as Universal Send launch boosts momentum

NEAR Protocol continued its strong rally on May 29 as the market reacted to a major product launch, rising network activity, and improving technical indicators across the broader crypto market . NEAR climbed more than 10% over the past 24 hours to trade around $2.56 at press time, extending its weekly gain to over 20%. Trading activity also accelerated sharply, with 24-hour trading volume crossing $815 million. Universal Send launch boosts investor sentiment One of the biggest drivers behind NEAR’s latest rally is the launch of Universal Send, a new payment and asset transfer system built on the NEAR ecosystem. The feature allows users to send tokens across different blockchains in a single transaction without manually bridging assets or swapping between networks. The process combines cross-chain transfers, token conversion, and settlement into one flow. The launch is tied to NEAR Intents, the protocol’s infrastructure layer designed to simplify blockchain transactions. According to the project, NEAR Intents has already processed more than $18 billion in cumulative transaction volume. The rollout appears to have strengthened investor confidence because it targets one of the biggest problems in crypto: the complexity of moving assets between blockchains. Under the new system, users can reportedly scan QR codes and pay with whatever token they already hold, while recipients receive their preferred asset automatically. The infrastructure relies on third-party execution agents known as “solvers” to complete transactions across networks. The project also introduced privacy-focused features tied to Trusted Execution Environment technology and a private NEAR shard, allowing transaction details and balances to remain hidden from public view during transfers. Technical indicators remain bullish despite overbought signals NEAR’s price structure has also improved significantly from a technical perspective over the past two weeks. NEAR is currently trading above its 10-day, 20-day, 50-day, 100-day, and 200-day exponential moving averages on the daily chart. Near protocol price analysis That setup is generally viewed as a sign of sustained upward momentum because the shorter-term averages remain stacked above the longer-term averages, while the 200-day EMA continues to act as long-term support. The token has also gained roughly 66.5% over the past 14 days and nearly 90% over the past month, showing how quickly momentum has accelerated since the beginning of May. However, some indicators suggest the rally may be becoming overheated in the short term. The Relative Strength Index (RSI-14) is currently around 64.70, approaching overbought territory and signalling that traders may begin taking profits after the strong upward move, which could in turn cause a short-term price correction. Near Protocol price forecast In the short term, the first major resistance sits around $2.97. A break above that level could open the door for another leg higher and potentially push the token toward the psychological $3 mark. On the downside, immediate support is seen near the $2.40-$2.45 range, while stronger structural support remains closer to the 200-day EMA. Analysts view those zones as important for maintaining the broader bullish structure that has formed over recent weeks. The post NEAR price jumps 10% as Universal Send launch boosts momentum appeared first on Invezz
29 May 2026, 17:17
Bitcoin Nears $72K Pivot as CFTC Greenlights Perp Futures and U.S. Constitution Etched On-Chain
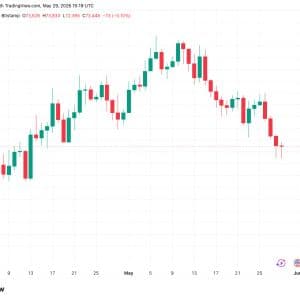
Bitcoin News Bitcoin extended a six-week low on Friday, sliding toward $72,395 on Bitstamp as Wall Street equities surged into fresh record territory. The decoupling between risk assets has sharpen...
29 May 2026, 17:05
Bitcoin ETFs Record $428M Inflow on May 28 After Multi-Session Outflows

US-listed spot Bitcoin ETFs recorded $428.6 million in net inflows on May 28, according to aggregated data from SoSoValue, CoinGlass, and Farside Investors. BlackRock's IBIT led with $236.4 million, extending a recovery after the complex shed $733.4 million on May 27.
29 May 2026, 17:03
Bitcoin plums new six-week lows as analyst eyes BTC price dip 'end' at $72K

Bitcoin saw its lowest levels since the middle of April as BTC price action continued ot diverge from thriving US stock markets.
