


 Invest ideas
News
25 May 2026, 12:56
Could Bitcoin Be Run by AI? It Eats Through Uber and Microsoft's Budgets in Months

Blockchain managed purely by AI is not a fantasy anymore: it's more than a possibility considering performance of modern agentic systems.
25 May 2026, 12:51
Why Has France Become the Most Dangerous Place to Hold Bitcoin?

France has become the main reported hotspot for violent physical attacks targeting cryptocurrency holders and their families, according to Bitcoin journalist Joe Nakamoto, who said about 70% of known global “wrench attacks” now occur in the country. Wrench attacks refer to physical violence, kidnapping, home invasion or extortion attempts aimed at forcing crypto holders to surrender private keys, wallet access or digital assets. The term has gained wider use as criminals increasingly target people believed to hold Bitcoin and other cryptocurrencies. Nakamoto said France has recorded 41 crypto-related kidnappings so far in 2026, equal to roughly one case every two and a half days. French authorities have also reported more than 40 cryptocurrency-linked kidnapping or hostage cases since January, according to figures cited by Le Monde. France Records Surge in Crypto Kidnappings French police have been investigating a wave of abductions and attempted kidnappings linked to cryptocurrency investors, executives, and their relatives. Officials said the trend began rising in late 2024, expanded in 2025 and continued into 2026. Several cases have drawn public attention. In January 2025, kidnappers abducted Ledger co-founder David Balland and his partner. Balland was later freed, but reports said his captors mutilated his hand and demanded a crypto ransom. In May 2026, the daughter of Paymium CEO Pierre Noizat escaped an attempted kidnapping in Paris. Video footage showed masked men trying to force her into a vehicle before she resisted with help from her husband. Another reported case involved the wife of The Sandbox co-founder Sebastien Borget. As we reported, she was targeted at the couple’s home in Villenoy by suspects posing as delivery workers. Neighbors intervened after hearing her cries, and two suspects were later arrested. KYC Data and Target Selection Under Scrutiny Nakamoto linked the rise in attacks partly to know-your-customer data collection. He said sensitive customer records stored on centralized servers may have helped criminals identify crypto holders after past data leaks. One of the most cited examples is the 2020 Ledger customer data leak, which exposed names, home addresses and email addresses of more than 270,000 customers worldwide. The incident remains a reference point in debates over crypto privacy and physical security. Jameson Lopp, chief executive of Casa, said France has become a warning case for the sector. He argued that financial regulations can create large stores of personal data that may place Bitcoin holders at risk when compromised. Investigators have said the structure of the attacks varies. French officials have described cases in which organizers may operate from abroad while recruiting young people in France to carry out abductions, surveillance, or logistics. French media reports said some suspects arrested in recent kidnapping probes were minors, while many others were under 20. Authorities have accused suspects of involvement in organized kidnapping, criminal conspiracy, and related offenses. Authorities Increase Arrests and Security Response French authorities have arrested dozens of people linked to crypto kidnapping investigations. National prosecutor Vanessa Perrée said at least 88 individuals have been arrested in connection with crypto wrench attacks in France. In one recent operation, police arrested 24 suspects connected to multiple kidnapping cases. Reports said the Banditry Repression Brigade intercepted one attempted abduction, while other arrests followed a separate attempt involving the daughter of a crypto investor. The French Interior Ministry has met with crypto industry representatives to discuss security threats facing investors, founders, and executives. During Paris Blockchain Week 2026, Minister Delegate Jean-Didier Berger announced preventive measures, including a dedicated prevention platform. Security specialists have advised crypto holders to reduce public exposure. Common recommendations include avoiding public claims about holdings, limiting personal information online, using professional custody tools and creating emergency protocols with trusted service providers. Some custody firms offer security phrases that can alert staff when a client is being coerced. In such cases, a provider may freeze access or contact law enforcement. Other advisers suggest maintaining a decoy wallet with a small balance, though users are also warned that physical safety should come before asset protection.
25 May 2026, 12:50
Whale's Insight: The Bond Market Just Broke - Where Does That Leave Bitcoin?

Summary U.S. 30Y Treasury yields hit 5.197%, the highest since July 2007, with Japan, U.K., and Germany breaking multi-decade or record highs in the same week. Energy-driven inflation, fiscal supply pressure and a fracturing Fed are driving a structural repricing of the macro discount rate. High yields pushed crypto into stocks. U.S. spot Bitcoin ETFs saw $649 million in single-day outflows. BofA's May survey shows institutions at net 44% underweight bonds and net 50% overweight equities, the largest single-month rotation on record. Longs squeezed across the curve. $657 million in liquidations on May 18, 89% on the long side. Combined with ETF outflows, on-chain leverage and off-chain institutional capital are bleeding at the same time. The bond market just broke. U.S. 30Y Treasury yields hit 5.197% this week, the highest since 2007, with Japan, U.K., and Germany simultaneously breaking multi-decade highs. The global bond market is rewriting the discount rate for every risk asset. As institutions rotate out of bonds and into stocks at a record pace, where does that leave crypto? The Global Bond Rout and What It Means for Crypto Global sovereign bonds suffered a synchronized selloff the week of May 19, pushing yields across the U.S., Japan, the U.K., and Germany to levels not seen in decades. Four major bond markets, four time zones, one direction: sell. What's Behind the Rout? First, energy-driven inflation is broadening. Tensions around the Strait of Hormuz have kept Brent crude near or above $100 per barrel, while U.S. gasoline inflation has accelerated sharply, with the CPI gasoline index up 28.4% yoy in April. Headline CPI rose 3.8% YoY, while final-demand PPI rose 6.0% YoY, its fastest annual pace since December 2022. Critically, price pressures are spreading beyond energy. Final-demand services PPI rose 1.2% in April, suggesting inflation pressure is broadening through the services channel and may also reflect tariff pass-through on top of the energy shock. Second, fiscal supply-demand mismatch is intensifying. The most acute case is the U.K., where 30-year gilt yields hit 5.868% on May 18, a 28-year high, as political uncertainty around Prime Minister Starmer intensified concerns over the U.K.’s fiscal credibility. The same logic applies broadly. Governments are issuing more debt to fund persistent deficits, while the marginal buyer demands higher compensation. When one of the world’s largest sovereign bond markets begins pricing a larger political-risk premium, it can force a broader re-rating of the long end across developed economies. 30-Year Gilt Price, Source: Financial Times Third, central bank credibility is fracturing. The Fed's April decision drew four dissents, the most since 1992, exposing a committee unable to agree on whether the next move is a hike or a cut. Rate futures now assign roughly 40% or higher odds to a hike by year-end, versus consensus expectations of multiple cuts at the start of the year. When the market shifts from pricing cuts to pricing hikes within five months, what is being repriced is not the path of rates but the market's confidence that the central bank's reaction function is still predictable. The leadership transition from Powell to Kevin Warsh adds another layer of uncertainty to an already divided committee. The Transmission to Crypto Is Direct A 30-year Treasury yield above 5% resets the opportunity cost for every non-yielding asset. Institutional capital faces a simple arithmetic problem. A 5% risk-free rate compounded over 30 years returns 4.3x. Every dollar allocated to BTC must beat that hurdle to justify its place in a portfolio. This repricing has already shown up in flows. U.S. spot Bitcoin ETFs recorded approximately $649 million in single-day net outflows on May 18, the largest since January, with the 10-day cumulative total reaching negative $1.6 billion. The pattern is clear. When long-end yields spike, BTC acts as a release valve for institutional risk reduction. It is liquid, trades around the clock, and carries no contractual cash flow to anchor its valuation. The deeper question is whether this yield environment is cyclical or structural. U.S. long-term rates declined for 40 years, with the 10-year Treasury yield falling from roughly 15% in 1981 to around 0.5% in 2020. That long downtrend underpinned much of the modern valuation framework. If it has reversed for crypto markets, this means the macro discount rate applied to risk assets may remain structurally higher , compressing the multiple that speculative capital is willing to pay for duration and volatility. High Yields Pushed Crypto Into Stocks U.S. spot Bitcoin ETFs ended a six-week inflow streak with the most pronounced redemption episode since February. The week of May 11–15 saw roughly $1.0 billion in net outflows, followed by a single-day net outflow of roughly $649 million on May 18, the largest daily redemption since January. The May 2026 BofA Global Fund Manager Survey (released May 20, polling 200 institutional managers overseeing $517 billion) shows where the money went: Bonds: net 44% underweight, the deepest negative positioning since June 2022 Global equities: net 50% overweight, the largest single-month jump on record Cash: 3.9%, falling below BofA's 4.0% "sell signal" threshold for the first time since February 2024 Commodities: net 31% overweight, reflecting inflation-hedge demand Notably, 62% of surveyed managers expect the U.S. 30-year Treasury yield is more likely to break above 6% than fall below 4%. Against this backdrop, duration exposure has become increasingly difficult to hold. Institutions exited bonds and rotated into equities, which are still benefiting from the AI earnings cycle. Crypto was vulnerable to the same rebalance because BTC ETFs are liquid, transparent, and easy to reduce when portfolios need to raise cash or fund risk elsewhere. Long Squeeze Across the Curve The recent pullback in BTC from roughly $82,000 to $76,000 over two weeks was enough to trigger a sequential unwind of long-side leverage in crypto perpetuals. Key data points: May 16 : About $500M in long liquidations as BTC fell toward $78,000 May 18 (24-hour window) : About $657M in total liquidations, of which $584M (89%) were longs , as BTC briefly slid below $77,000 When liquidation composition tilts this heavily toward longs (close to 89%), it suggests the market was heavily skewed toward upside exposure heading into the move. BTC perpetual futures open interest posted its fastest growth of 2026 during the first half of May as BTC pushed past $80,000. Longs crowded in while macro risks remained unresolved, leaving the market vulnerable to a leverage flush. Combined with the ETF outflows discussed above, both derivatives leverage and off-chain institutional capital were being unwound simultaneously. BTC has now stabilized around $77,000, but the buy-side has clearly weakened. The market sits in a silent holding pattern, waiting for the next signal. Week Ahead Ongoing: U.S.-Iran geopolitical tensions and energy supply risk May 27: RBNZ Interest Rate Decision May 28: U.S. Q1 GDP Second Estimate May 28: Core PCE Price Index (April) Thursday's data dump is the week's focal point. Core PCE arrives after Q1 advance GDP already showed PCE prices accelerating to 4.5% annualized. Any upside surprise reinforces the "higher-for-longer" repricing driving the Treasury yield move; a simultaneous GDP hold near 2.0% would add stagflationary undertones. RBNZ is expected to hold the OCR at 2.25%, with the decision likely reflecting how developed-market central banks are collectively responding to elevated oil prices. The U.S.-Iran situation continues to keep crude at elevated levels, and the inflationary transmission is deepening and broadening across global supply chains. Disclaimer: The information provided herein does not constitute investment advice, financial advice, trading advice, or any other sort of advice, and should not be treated as such. All content set out above is for informational purposes only. Original Post
25 May 2026, 12:45
Bitcoin risks drop to $72K as demand metric hits 2026 lows

Bitcoin’s weakening demand failed to absorb increased selling pressure, raising risks of a further BTC price drop toward $72,000.
25 May 2026, 12:40
Eric Trump Sets A “Beyond Catastrophic” Bar To Sell Bitcoin — How Far Are We From That?

Eric Trump, co-founder and Chief Strategy Officer of American Bitcoin Corp., has revealed the conditions under which he would sell Bitcoin — and the threshold he has set is so extreme it amounts to a declaration that, under any foreseeable market scenario, he is not selling. Speaking in an interview for the Bonnie Blockchain channel published on May 12, Trump was asked directly about the circumstances that could force American Bitcoin to liquidate its holdings. His answer was unambiguous. Selling would require something “beyond catastrophic,” per the interview — a framing that places the sell threshold so far outside normal market volatility, regulatory pressure, or even prolonged bear markets that it functions less as a risk management policy and more as a philosophical commitment to permanent accumulation. The Two Races — And Why Selling Bitcoin Loses Both The broader context behind Trump’s sell-never posture is the dual competitive framework he laid out in the same interview. According to Trump, the Bitcoin treasury space is defined by two simultaneous races: one for the largest total Bitcoin holdings, and one for the lowest possible acquisition cost. American Bitcoin, he argued, is competing in both — and selling Bitcoin loses ground in the first race immediately while undermining the entire logic of the second. The company’s north star metric, per Trump’s interview, is growing “satoshis per share” — a measurement of how much Bitcoin each outstanding share of ABTC represents. Every Bitcoin sold dilutes that figure. Every Bitcoin mined and retained compounds it. The accumulation model only works if the coins stay, which makes the “beyond catastrophic” sell threshold not a rhetorical flourish but a structural requirement of the strategy itself. The Saylor Reference — And The Divergence Trump acknowledged Michael Saylor’s role in building the Bitcoin treasury category, describing him as a visionary and praising Strategy’s approach, per the interview. But he drew a pointed distinction. Saylor recently suggested that Strategy could sell some Bitcoin to help fund dividend payments — a hint of flexibility in the accumulation model that Trump appears unwilling to replicate. American Bitcoin, he made clear, is following a stricter retention framework. Where Strategy accumulates primarily through capital markets and has signaled some exit flexibility, ABTC accumulates through mining — at a cost it claims is approximately 53% below spot — and holds without exception, per the interview. The distinction matters for how investors read both companies. A sell-never posture from a mining-integrated treasury firm is more operationally credible than the same posture from a pure accumulator, because the marginal cost of each new coin is structurally lower and the balance sheet pressure to monetize is reduced accordingly. For the nascent sector’s growing cohort of Bitcoin treasury companies, Trump’s “beyond catastrophic” framing marks a pivotal benchmark — the most unambiguous long-term accumulation commitment any publicly listed executive has put on record this cycle. Whether the market rewards that conviction or punishes the rigidity will depend on where Bitcoin trades over the next several years. As of this writing, Bitcoin trades at around $82,000, with American Bitcoin’s treasury holding over 7,000 BTC as the company continues what its co-founder has now publicly described as an unconditional accumulation strategy. Cover image from Grok, BTCUSD Chart from Tradingview
25 May 2026, 12:38
Ethereum Price Prediction: ETH Battles 100-Day MA as $2K Support Holds the Key
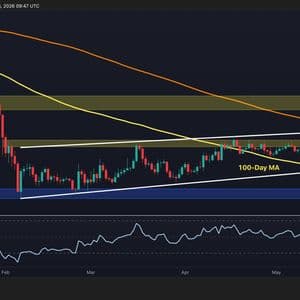
Ethereum is trading at $2,120 as the final week of May begins, caught in a tug-of-war with the 100-day MA that encapsulates everything frustrating about this cycle. Having briefly reclaimed the moving average in late April for the first time since the correction began, ETH surrendered it again during the May breakdown and is now trading just below it. Yet, the moving average is close enough that a single strong daily close could flip the script, but it has been unable to do so with the momentum currently available. The next few days will determine whether that reclaim sticks or the key $1.8K demand zone finally becomes the next topic of conversation. Ethereum Price Analysis: The Daily Chart On the daily chart, it is evident that ETH briefly reclaimed the declining 100-day moving average in late April, only to lose it again during the May breakdown. The price is now trading just below it at approximately $2.1K, with the 100-day moving average sitting a short distance overhead and acting as resistance once more rather than support. The RSI has also recovered from its low last week near 30 to approximately 40, which is a modest bounce with no directional conviction yet. The dynamic has shifted subtly but meaningfully, as this is no longer a case of the 100-day MA sitting far above as an aspirational target. It is close enough to touch, and the daily closes around $2.1K represent an ongoing battle to reclaim it. A sustained close above the moving average and the $2.2k level would confirm the reclaim and shift the structure back toward neutral. On the other hand, a close below $2,000 would simultaneously breach the ascending channel’s lower boundary, leaving $1.8k as the only remaining structural support before a full reassessment of the recovery thesis. Source: TradingView ETH/USDT 4-Hour Chart The 4-hour chart shows the price compressing into an increasingly tight range between the $2k support zone below and the $2.15k area overhead. The RSI is recovering from oversold territory to just above 50, which is enough to stabilize the market without yet generating upside momentum. The white ascending channel’s lower boundary at $2.08k converges with the lower boundary of the $2.15k resistance zone, making that band the last technical defense before $1.8k. The first meaningful target above is the $2.25k zone, which is the level that acted as support through most of April and early May before the breakdown. A 4-hour close back above it would signal that the worst of the selling pressure has passed and open a path toward $2.4k. Until that reclaim happens, the tight range between $2.15k and $2k is likely to continue as the market waits for a catalyst in either direction. Source: TradingView Sentiment Analysis ETH’s funding rate has been predominantly positive throughout most of the corrective phase, with only brief negative spikes rather than the sustained red dominance. The notable exception was late April, when funding tilted mostly negative for an extended stretch, which coincided with the period where price stalled repeatedly at $2.4k and eventually broke down. That negative phase appears to have cleared, as funding has returned to positive and has recently printed some of the higher green readings of the past two to three months. The current reading of +0.005 sits at the upper end of what has been a muted range. The timing of this shift matters. Funding turning aggressively positive while price is sitting at $2.1k, closer to the multi-month lows than to resistance, suggests that a fresh cohort of longs is building positions at current levels with conviction rather than chasing a breakout. The current setup is more structurally sound, as longs are accumulating near support rather than at the ceiling. Whether that conviction is rewarded depends entirely on whether the $2k channel floor holds and the 100-day moving average is reclaimed again. Source: TradingView The post Ethereum Price Prediction: ETH Battles 100-Day MA as $2K Support Holds the Key appeared first on CryptoPotato .


