


 Invest ideas
News
22 May 2026, 10:23
Mark Cuban remains bullish on Ethereum

Mark Cuban, a billionaire investor and television personality, says that he has sold most of his Bitcoin ( BTC ) because the cryptocurrency failed as a hedge against inflation . In contrast, he remains bullish on Ethereum ( ETH ). Speaking on the Front Office Sports show , Cuban, who had previously viewed Bitcoin as a better version of gold , argued that the leading digital asset hasn’t benefited at all from the weakening dollar and rising geopolitical tensions. Touching on the ongoing Iran conflict, the entrepreneur said that gold rallied sharply while Bitcoin declined, undermining its long-standing investment thesis as an alternative to fiat. “I think Bitcoin has lost the plot. When I started buying Bitcoin – and I’ve sold all of it (except not all of it, but most of it) – it was because when all the shit hit the fan with the Iran war and all, Bitcoin was always the best alternative to fiat currency losing its value,” Cuban said. Mark Cuban on crypto: "Bitcoin has lost the plot. I always thought it was a better version of gold than gold. Well, gold just blew up, Bitcoin dropped. Not the hedge I expected it to be." says he sold most of his BTC. as for memecoins? "garbage." https://t.co/EgH1rd5GGJ pic.twitter.com/oYRMye3DEg — Daniel Roberts (@readDanwrite) May 21, 2026 ‘Ethereum is less disappointing than Bitcoin’ In Cuban’s view, Bitcoin should have rallied every time the dollar went down, which it didn’t. While the expectations may appear highly unrealistic, the remarks are noteworthy as they represent a notable shift for the billionaire. Indeed, Cuban had publicly defended ‘digital gold’ as a superior alternative to gold for years because of its fixed supply and decentralized structure. In a 2021 appearance on The Delphi Podcast , for example, he said his crypto portfolio was made up of roughly 60% Bitcoin. “I always thought it was a better version of gold than gold. Well, gold just blew up and went to $5,000. Bitcoin dropped. Every time the dollar, Bitcoin should’ve gone up because it was priced in dollars… Not the hedge I expected it to be… I’d say I’m more disappointed in Bitcoin, not so disappointed in Ethereum,” he added. Compared to Bitcoin, Cuban views Ethereum as ‘less disappointing,’ and as for the other cryptocurrencies, the businessman simply dismissed most of them as ‘garbage.’ Featured image via Shutterstock The post Mark Cuban remains bullish on Ethereum appeared first on Finbold .
22 May 2026, 10:23
Crypto majors stuck in tight range as altcoin rotation picks up steam
Bitcoin holds between $76,000 and $78,000 while AI tokens and HYPE surge; derivatives signal calm conditions with volatility selling dominating options markets.
22 May 2026, 10:23
Crypto Market Eyes $2.60T as NEAR Jumps 21%, SpaceX Confirms 18,712 BTC Treasury
Crypto News Blind signing — the practice of approving DeFi transactions without seeing readable instructions — has been linked to billions in user losses, and a new wallet integration is targeting ...
22 May 2026, 10:21
Bitcoin open interest surges above $8.9 billion on Binance
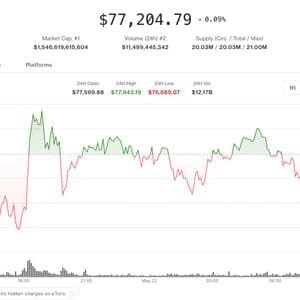
Bitcoin ( BTC ) has recorded a 40% increase in its Open Interest (OI) – its total open futures contracts – on Binance, the largest cryptocurrency exchange by daily traded volume, over the past 82 days. Between early March and May 22, Bitcoin’s OI rose by $2.56 billion, increasing from $6.4 billion to around $8.9 billion, according to CryptoQuant data analyzed by Finbold. BTC deleveraging signal. Source: CryptoQuant Consequently, BTC’s OI has now risen above its 180-day Moving Average (MA), which may signal the end of the deleveraging event that began after the October 11, 2025, crypto crash. “Despite a macro environment that has continued to deteriorate, Bitcoin’s sharp correction attracted more speculative traders looking to play a rebound,” analyst Darkfost from CryptoQuant, stated . What’s next for Bitcoin price amid rising OI? Amid the significant spike in Bitcoin’s OI on Binance, its Funding Rates – a set fee meant to maintain perpetual contract price pegged to the underlying asset – have shifted positive, based on metrics from CoinGlass . Historically, when BTC’s OI shifts to the positive side, it signals bullish sentiment, as traders are willing to pay a premium to hold their long positions. BTC OI-weighted Funding Rate. Source: CoinGlass As such, Bitcoin price could rebound above $80,000 again in the near future, fueled by rising leverage of bullish traders. However, Finbold AI Agent – an advanced financial assistance tool – has predicted a further BTC price drop over the next 7 days, potentially catalyzed by a long squeeze, a rapid price decline driven by a shift in long bets to short traders. Bitcoin price prediction for 7 days. Source: Finbold As Bitcoin price traded around $77,145 at press time, the Finbold AI Agent predicted the flagship coin could drop 2.34% to $75,343 on May 29. However, if BTC price regains its psychological support level above $80,000 in the coming days, its rising OI amid positive funding rate could fuel further bullish sentiment. The post Bitcoin open interest surges above $8.9 billion on Binance appeared first on Finbold .
22 May 2026, 10:15
Polymarket Confirms User Funds Safe After Exploit, Core Infrastructure Unaffected

BitcoinWorld Polymarket Confirms User Funds Safe After Exploit, Core Infrastructure Unaffected Polymarket, the leading decentralized prediction market platform, has moved to reassure users following a security incident involving its UMA CTF adapter contract. In an official statement, the platform confirmed that user funds and market settlements remain secure, with the exploit limited to a specific operational wallet. Details of the Incident Polymarket protocol developer Shantikiran Chanal addressed the situation on X, stating that the company is aware of a security incident related to reward payments. The ongoing investigation indicates that a private key for an internal operations wallet was exposed, but the platform’s core smart contracts and infrastructure were not compromised. This distinction is crucial, as it means the underlying mechanics of the prediction markets themselves were not attacked. Scale of the Exploit While Polymarket works to contain the breach, on-chain data from Santiment reveals the exploit’s impact. The attacker has been systematically draining 5,000 POL tokens approximately every 30 seconds. At current market rates, the total amount stolen has reached an estimated $520,000. The exploit specifically targeted the UMA CTF (Capture The Flag) adapter contract, which is used for reward distribution in certain platform activities. What This Means for Users For the average Polymarket user, the primary takeaway is that their positions and funds are safe. The platform has emphasized that market settlements are proceeding normally and that no user assets were directly accessed. However, the incident highlights the ongoing risks associated with operational security in the decentralized finance (DeFi) space, where even isolated private key compromises can lead to significant financial losses. Broader Implications for Prediction Markets This event serves as a reminder of the layered security challenges faced by crypto platforms. While smart contract vulnerabilities often dominate headlines, this exploit underscores the importance of securing internal operational wallets and private key management. For Polymarket, which has seen a surge in user activity and trading volume ahead of major political events, maintaining user trust is paramount. The platform’s swift and transparent communication regarding the incident is a positive signal for its commitment to security. Conclusion The Polymarket exploit, while concerning, appears to be contained to a specific, non-critical part of the platform’s operations. User funds remain secure, and the core infrastructure continues to function. The incident, however, has resulted in the loss of over half a million dollars in POL tokens and serves as a critical case study in the importance of comprehensive security protocols that extend beyond smart contract audits. FAQs Q1: Were my funds on Polymarket affected by the exploit? A1: No. Polymarket has confirmed that user funds and market settlements were not affected. The exploit was limited to a specific internal operations wallet used for reward payments. Q2: What was the cause of the exploit? A2: The investigation indicates that a private key for an internal operations wallet was exposed. The platform’s core smart contracts and infrastructure were not attacked. Q3: How much was stolen in the Polymarket exploit? A3: On-chain data from Santiment shows that the attacker has stolen approximately $520,000 worth of POL tokens, draining 5,000 POL every 30 seconds. This post Polymarket Confirms User Funds Safe After Exploit, Core Infrastructure Unaffected first appeared on BitcoinWorld .
22 May 2026, 10:10
BTC Spot CVD Chart Analysis: Volume Heatmap and Order Flow Insights for May 22
BitcoinWorld BTC Spot CVD Chart Analysis: Volume Heatmap and Order Flow Insights for May 22 On May 22, the BTC/USDT spot pair presented a detailed picture of market microstructure through the Spot Cumulative Volume Delta (CVD) chart. This analysis breaks down the order book into two key components: a volume heatmap in the upper section and the CVD indicator below, offering traders a granular view of buying and selling pressure. Understanding the Volume Heatmap The volume heatmap tracks trading activity at specific price levels. Brighter background zones indicate areas where the price either consolidated for an extended period or experienced a significant move. These zones can act as potential support or resistance levels in future trading sessions. For May 22, the heatmap highlighted a concentration of activity near the $67,000 and $68,500 levels, suggesting these are key price thresholds to watch. Decoding the Cumulative Volume Delta (CVD) The CVD indicator, displayed in the lower section of the chart, breaks down buy and sell orders by trade size. Each colored line represents a specific order size bracket. For example, the yellow line tracks orders between $100 and $1,000, while the brown line monitors large orders ranging from $1 million to $10 million. An upward movement in any line signals an increase in buy orders for that size category. On May 22, the CVD showed a notable rise in medium-sized orders (yellow and green lines), indicating steady accumulation by retail and mid-tier traders, while large institutional orders (brown line) remained relatively flat, suggesting a cautious stance among whales. What This Means for Traders For traders, the combination of the volume heatmap and CVD provides a real-time read on market sentiment. The bright zones on the heatmap can serve as reference points for entry or exit strategies, while the CVD reveals whether buying or selling pressure is dominating at each price level. The current data points to a market where smaller participants are driving momentum, but larger players are holding back—a dynamic that could lead to increased volatility if institutional interest shifts. Conclusion The BTC spot CVD chart for May 22 offers a clear window into order flow dynamics. With the volume heatmap highlighting key support and resistance zones, and the CVD showing a divergence between retail and institutional activity, traders have actionable data to inform their decisions. Monitoring these indicators in real time can help anticipate potential breakout or reversal points. FAQs Q1: What is the Spot Cumulative Volume Delta (CVD) chart? The Spot CVD chart is a trading tool that analyzes the order book for a specific trading pair, such as BTC/USDT. It includes a volume heatmap to show price-level activity and a CVD indicator that tracks buy versus sell orders by trade size. Q2: How do I interpret the volume heatmap? Brighter areas on the heatmap indicate higher trading volume or prolonged price consolidation at those levels. These zones often act as future support or resistance, making them useful for setting stop-loss or take-profit orders. Q3: What does a rising CVD line mean? A rising CVD line for a specific order size bracket (e.g., yellow for $100–$1,000 orders) indicates an increase in buy orders relative to sell orders within that size range. This suggests buying pressure from that category of traders. This post BTC Spot CVD Chart Analysis: Volume Heatmap and Order Flow Insights for May 22 first appeared on BitcoinWorld .


