


News
28 May 2026, 05:55
Gold Tests $4,376 Support, US Moves $1.9M Alameda Altcoins, Oil Crashes 6% on Hormuz Deal
Crypto News The next decade is taking shape around a fundamentally more multipolar global order, and that shift is reshaping how reserve capital flows into hard assets. The post-1991 era of a singl...
28 May 2026, 05:50
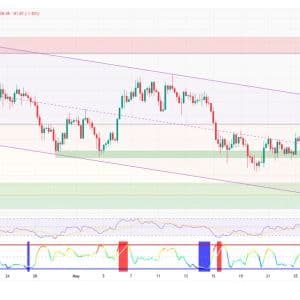
AUD/USD Price Forecast: Head and Shoulders Pattern Signals Potential Breakdown

BitcoinWorld AUD/USD Price Forecast: Head and Shoulders Pattern Signals Potential Breakdown The Australian dollar is flashing a technical warning sign against its US counterpart. The AUD/USD currency pair is teetering on the edge of a classic head and shoulders breakdown, a pattern that often signals a reversal from an uptrend to a downtrend. For forex traders, this formation warrants close attention as it could define the pair’s direction in the coming sessions. Understanding the Head and Shoulders Pattern The head and shoulders pattern is one of the most reliable reversal formations in technical analysis. It consists of three peaks: a higher middle peak (the head) flanked by two lower peaks (the shoulders). The neckline, drawn by connecting the lows of the two troughs, acts as a critical support level. A decisive break below the neckline confirms the pattern and typically projects a measured move lower equal to the distance from the head to the neckline. In the case of AUD/USD, the pattern has been developing over several weeks. The left shoulder formed in early March, followed by a higher high in late March that created the head. The right shoulder is currently forming, with the price action showing an inability to reclaim the highs. The neckline currently sits near the 0.6450 level, and a daily close below this threshold would trigger the breakdown signal. Key Support Levels and Potential Targets If the neckline breaks, the measured move target projects a decline toward the 0.6250 region. This area also coincides with a prior support zone from February, adding confluence to the bearish scenario. Immediate support below the neckline lies at 0.6400, a psychological level that could provide temporary relief before further selling pressure. On the upside, resistance is now defined by the right shoulder high near 0.6580. A move above this level would invalidate the pattern and suggest the bullish trend remains intact. However, with the RSI on the daily chart showing bearish divergence and momentum indicators turning lower, the path of least resistance appears to be to the downside. Fundamental Factors Reinforcing the Technical View The technical setup aligns with the broader fundamental backdrop. The Reserve Bank of Australia (RBA) has signaled a cautious stance on monetary policy, while the US Federal Reserve remains hawkish on interest rates. The widening interest rate differential between the two currencies continues to favor the US dollar. Additionally, risk sentiment has been fragile due to concerns over global growth and commodity price volatility, both of which weigh on the Australian dollar as a proxy for risk appetite. China’s economic data, a key driver for the Aussie, has shown mixed signals. While industrial production has stabilized, the property sector remains under pressure, limiting the upside for commodity-linked currencies like the AUD. Until there is a clear catalyst for a shift in sentiment, the technical pattern is likely to dominate price action. Conclusion The AUD/USD pair is at a critical juncture. The head and shoulders pattern is a clear technical warning that the recent uptrend may be exhausted. Traders should watch for a confirmed break below the neckline near 0.6450 as a trigger for further downside toward 0.6250. A failure to break lower would keep the pair in a range, but the balance of evidence currently favors the bears. As always, prudent risk management is essential given the potential for false breakouts in volatile markets. FAQs Q1: What does a head and shoulders breakdown mean for AUD/USD? A head and shoulders breakdown signals a potential reversal from an uptrend to a downtrend. For AUD/USD, a break below the neckline around 0.6450 would indicate that sellers have taken control, with a measured move target near 0.6250. Q2: How reliable is the head and shoulders pattern in forex trading? The head and shoulders pattern is considered one of the more reliable reversal patterns, especially on higher timeframes like the daily chart. However, no pattern is 100% accurate. False breakouts can occur, so traders often wait for a daily close below the neckline or a retest of the level as resistance before entering a trade. Q3: What factors could invalidate the head and shoulders breakdown? The pattern would be invalidated if the price breaks above the right shoulder high near 0.6580. A strong fundamental catalyst, such as a surprise dovish shift from the Fed or a hawkish surprise from the RBA, could also reverse the bearish bias. Additionally, a broad risk-on rally in global markets could lift the Australian dollar despite the technical pattern. This post AUD/USD Price Forecast: Head and Shoulders Pattern Signals Potential Breakdown first appeared on BitcoinWorld .
28 May 2026, 05:30
Falcon Unveils GENIUS-ready fUSD Stablecoin Backed by Anchorage Digital Bank

Falcon Finance has introduced fUSD, a fully reserved stablecoin issued by Anchorage Digital Bank and designed for institutional settlement, collateral, and treasury use. The product includes a rewards structure targeting about 3% annually for qualifying institutional holders. fUSD Offers Regulated Stablecoin With Monthly Rewards for Institutions Falcon Finance has unveiled fUSD, a stablecoin aimed at
28 May 2026, 05:30
Gold Price in India Dips Today, Tracking Global Trends: Bitcoin World Data
BitcoinWorld Gold Price in India Dips Today, Tracking Global Trends: Bitcoin World Data Gold prices in India moved lower in today’s trading session, according to data compiled by Bitcoin World. The decline aligns with global market pressures, as investors weigh shifting interest rate expectations and a firmer US dollar. Today’s Gold Rate Movement As of the latest update, the price of 24-carat gold in India fell by approximately 0.3% to 0.5% across major bullion markets, including Mumbai, Delhi, and Ahmedabad. The decline follows a similar pullback in international spot gold prices, which retreated from recent highs as market sentiment turned cautious. Bitcoin World data shows that the domestic price correction was broad-based, affecting both standard 24-carat and 22-carat variants. Silver prices also edged lower in tandem, reflecting the broader weakness in precious metals. Key Drivers Behind the Decline Market analysts attribute the dip to a combination of factors. The US dollar index strengthened during Asian trading hours, making dollar-denominated gold more expensive for holders of other currencies, including the Indian rupee. Additionally, rising bond yields in major economies have reduced the relative appeal of non-yielding assets like gold. In India, domestic demand remained subdued as traders adopted a wait-and-watch approach ahead of key economic data releases. The Reserve Bank of India’s recent monetary policy stance also continues to influence investor appetite for the yellow metal. Impact on Indian Consumers and Investors For Indian consumers, the dip offers a modest buying opportunity for jewelry and investment purposes, though the decline is not dramatic. Investors holding gold ETFs and sovereign gold bonds may see a temporary markdown in their portfolio values. However, analysts note that gold remains a key hedge against inflation and geopolitical uncertainty, and the current correction is seen as a normal market fluctuation rather than a structural shift. Conclusion The decline in gold prices in India today, as reported by Bitcoin World data, reflects a broader global trend driven by a stronger dollar and rising bond yields. While the dip is modest, it underscores the metal’s sensitivity to macroeconomic signals. Investors and consumers should monitor upcoming US Federal Reserve commentary and domestic inflation data for further direction. FAQs Q1: Why did gold prices fall in India today? The decline is primarily due to a stronger US dollar and rising global bond yields, which reduced gold’s appeal as an investment. Bitcoin World data captured the downward movement across Indian bullion markets. Q2: Is this a good time to buy gold in India? The current dip is modest. For long-term investors, any price correction can be a buying opportunity, but it is advisable to monitor global trends and consult a financial advisor before making large purchases. Q3: How does the global gold price affect Indian rates? India imports most of its gold, so domestic prices closely track international spot prices, adjusted for import duties, taxes, and the rupee-dollar exchange rate. A fall in global prices generally leads to lower domestic rates. This post Gold Price in India Dips Today, Tracking Global Trends: Bitcoin World Data first appeared on BitcoinWorld .
28 May 2026, 05:25
Silver Price Forecast: XAG/USD Falls Below $72.50 as US Strikes in Iran Trigger Bearish Technical Signals
BitcoinWorld Silver Price Forecast: XAG/USD Falls Below $72.50 as US Strikes in Iran Trigger Bearish Technical Signals Silver prices (XAG/USD) slipped below the $72.50 mark during Wednesday’s trading session, extending losses after reports of US military strikes in Iran. The move comes as traders digest a fresh wave of geopolitical uncertainty that has simultaneously boosted safe-haven demand for gold while triggering profit-taking and bearish technical patterns in silver. Geopolitical Catalyst: US Strikes in Iran News of US airstrikes on Iranian military positions broke late Tuesday, sending shockwaves through commodity markets. While gold initially rallied on heightened避险 (risk aversion) flows, silver experienced a more muted response, with prices actually declining. Analysts attribute this divergence to silver’s dual nature as both a precious metal and an industrial commodity. The strikes raise concerns about supply chain disruptions in the Middle East, but also about a potential slowdown in global industrial activity, which weighs on silver’s industrial demand outlook. Technical Breakdown: Bearish Signals Mount From a technical perspective, XAG/USD has broken below the key $72.50 support level, a zone that had held firm for the past two weeks. The breakdown was accompanied by an increase in volume, suggesting genuine selling pressure rather than a false move. The Relative Strength Index (RSI) has dipped below 50, entering bearish territory, while the Moving Average Convergence Divergence (MACD) has triggered a sell signal. Key Levels to Watch The next major support level lies at $71.00, a psychological round number and a previous resistance-turned-support area from early March. A break below that could open the door to a test of the $69.50 region, which represents the 200-day moving average. On the upside, silver must reclaim $73.50 to negate the current bearish bias. Resistance is now stacked at $74.00 and $75.20. Why This Matters for Investors For precious metals traders, the current setup presents a cautionary signal. While geopolitical events often drive short-term volatility, the underlying technical deterioration in silver suggests that the market is pricing in more than just the Iran headlines. Traders should monitor upcoming US economic data, particularly non-farm payrolls and inflation reports, which could further influence the Federal Reserve’s policy path and, by extension, silver’s trajectory. Conclusion The combination of a bearish technical breakdown and a complex geopolitical catalyst makes the near-term outlook for silver uncertain. While the metal retains its long-term appeal as a hedge against inflation and currency debasement, short-term traders should exercise caution. A close below $71.00 would confirm a deeper correction, while a recovery above $73.50 would signal that buyers are regaining control. FAQs Q1: Why did silver fall when US strikes in Iran usually boost safe-haven assets? Silver’s industrial demand component creates a drag during geopolitical crises that threaten global economic growth. Gold, which is less tied to industrial cycles, typically benefits more directly from pure safe-haven flows. Q2: What is the key support level for silver right now? The immediate support is at $71.00, followed by the 200-day moving average near $69.50. A sustained break below these levels could signal a longer-term downtrend. Q3: How does US monetary policy affect silver prices? Silver is highly sensitive to real interest rates and the US dollar. A hawkish Fed that raises rates or signals tighter policy typically strengthens the dollar and pressures silver, while a dovish stance supports higher prices. This post Silver Price Forecast: XAG/USD Falls Below $72.50 as US Strikes in Iran Trigger Bearish Technical Signals first appeared on BitcoinWorld .
28 May 2026, 05:05
New Zealand Dollar Slides as Government Unveils Fiscal Blueprint
BitcoinWorld New Zealand Dollar Slides as Government Unveils Fiscal Blueprint The New Zealand Dollar (NZD) experienced a notable decline against major counterparts on Thursday, following the government’s release of its latest annual budget. The currency’s move lower reflects a market assessment of the fiscal roadmap, with traders scrutinizing spending plans, revenue forecasts, and the overall economic outlook presented by Finance Minister Nicola Willis. Market Reaction to the Fiscal Announcement The NZD weakened by approximately 0.6% against the US Dollar in the hours immediately after the budget was tabled in Parliament. Analysts pointed to several key factors driving the sell-off. The budget projected a delayed return to surplus, now expected in 2027-28, later than previously forecast. Additionally, gross domestic product (GDP) growth forecasts were revised downward for the current fiscal year, contributing to a more cautious sentiment among currency traders. The government’s spending envelope was also a focal point. While new investments in health, infrastructure, and law and order were announced, the overall fiscal stance was perceived as expansionary at a time when the Reserve Bank of New Zealand (RBNZ) is still grappling with above-target inflation. This tension between fiscal and monetary policy goals often creates headwinds for a currency. Key Budget Details and Economic Projections Finance Minister Willis presented a budget that aimed to balance cost-of-living relief for households with fiscal discipline. Core elements included: Tax adjustments: Changes to income tax brackets designed to provide modest relief for middle-income earners. Infrastructure spending: Increased allocations for transport, housing, and renewable energy projects. Health and education: Continued funding increases for public services, though with an emphasis on efficiency gains. The Treasury’s accompanying economic and fiscal update revised down near-term GDP growth to around 1.5% for the current year, citing persistent global headwinds and subdued domestic demand. This weaker growth outlook directly influenced the NZD’s depreciation, as it reduces the likelihood of aggressive interest rate hikes from the RBNZ. Implications for Forex Traders and Investors For currency markets, the budget’s signal is one of a slower economic recovery and a potentially more accommodative monetary policy path. The NZD is now trading near key technical support levels against the USD, and a break below could open the door to further losses. Traders will be closely watching upcoming RBNZ commentary for any shift in tone regarding interest rates. Bond markets also reacted, with yields on New Zealand government bonds edging lower as the budget’s larger-than-expected borrowing program was partially offset by weaker growth projections. This combination typically weighs on a currency, as lower yields reduce the attractiveness of holding NZD-denominated assets. Conclusion The New Zealand Dollar’s post-budget decline underscores the market’s focus on the interplay between fiscal policy and economic fundamentals. While the government aims to support households and invest in long-term infrastructure, the immediate market verdict has been negative, reflecting concerns over the pace of fiscal consolidation and the growth outlook. The NZD’s trajectory in the coming weeks will likely hinge on incoming economic data and any further clarity from the RBNZ on its policy stance. FAQs Q1: Why did the New Zealand Dollar drop after the budget? The NZD fell because the budget revealed weaker-than-expected GDP growth forecasts and a delayed return to a fiscal surplus. This dampened investor confidence and reduced expectations for aggressive interest rate hikes by the Reserve Bank of New Zealand. Q2: What are the main factors affecting the NZD right now? The NZD is being influenced by domestic fiscal policy (the budget), the Reserve Bank’s monetary policy stance, global economic conditions (particularly in China, a major trading partner), and commodity prices. The budget added to existing uncertainty about the pace of economic recovery. Q3: How might the budget affect interest rates in New Zealand? The budget’s expansionary fiscal measures could keep inflationary pressures elevated, potentially making the RBNZ cautious about cutting rates too quickly. However, the weaker growth outlook might also give the central bank room to hold rates steady for longer, rather than hiking further. The net effect is increased uncertainty. This post New Zealand Dollar Slides as Government Unveils Fiscal Blueprint first appeared on BitcoinWorld .


