


News
23 May 2026, 21:00
XRP Exchange Reserve Drops to 2.70 Billion Amid Market Volatility

XRP’s exchange activity signals continued accumulation from retail and institutional traders despite the asset’s weak price move.
23 May 2026, 20:57
New Fed Chair Warsh Eyed for Rate Cuts as ECB Rejects Euro Stablecoin Easing Push
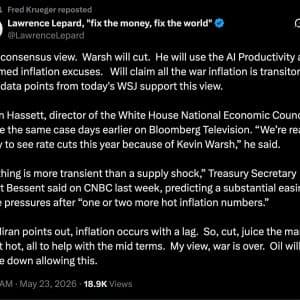
Crypto News Kevin Warsh, sworn in as Federal Reserve Chairman on Friday, is expected to lower interest rates despite widespread market consensus pricing in a hike, according to author and Bitcoin i...
23 May 2026, 19:00
Bitcoin is ready to beat stocks and bonds again after underperformance against Wall Street

Former Credit Suisse global head of portfolio and Risk Dimensions CIO Mark Connors says bitcoin has broken out of its longest stretch of underperformance in history and is ready to beat stocks, bonds, and gold as inflation stubbornly sticks around.
23 May 2026, 18:45
FDIC proposes anti-money laundering rules for bank-affiliated stablecoin issuers

Bank-affiliated stablecoin issuers will now be expected to comply with the same anti-money laundering and sanctions requirements that govern traditional financial institutions. The change is due to a proposed rule that was recently approved by the Federal Deposit Insurance Corporation (FDIC). The FDIC is also separately preparing to modernize anti-money laundering (AML) rules for stablecoins. What is the FDIC asking stablecoin issuers to do? The Federal Deposit Insurance Corporation recently approved a proposed rule that will apply the Bank Secrecy Act (BSA) and its sanctions to all permitted payment stablecoin issuers (PPSIs) that operate as subsidiaries of FDIC-supervised state nonmember banks and state savings associations. Under the GENIUS Act , the FDIC holds primary federal regulatory authority over these entities. The rule mandates stablecoin issuers to comply with anti-money laundering (AML) rules, rules that counter the financing of terrorism (CFT), economic sanctions programs, and reporting obligations set by the Treasury Department’s Financial Crimes Enforcement Network (FinCEN) and the Office of Foreign Assets Control (OFAC). The rule would also give the FDIC supervision and enforcement powers over these AML/CFT programs. This proposal is the FDIC’s third rulemaking tied to the GENIUS Act. The agency first proposed an application process for bank subsidiaries intended to issue stablecoins in December 2025, then followed with a prudential framework regarding reserve assets, redemption procedures, capital, and risk management standards in April 2026. The ABA Banking Journal noted that the GENIUS Act directed all federal banking agencies to write implementing regulations for stablecoin issuers, not just the FDIC. The Office of the Comptroller of the Currency (OCC) published its own proposal in February, and FDIC Chair Travis Hill has said the agency aligned its approach with the OCC’s where relevant. The FDIC estimates that between 5 and 30 banks will apply for and receive approval to issue stablecoins in the initial years after the GENIUS Act takes effect, which the agency expects around mid-January 2027. Is the FDIC modernizing AML rules? The FDIC, OCC, and National Credit Union Administration jointly proposed an overhaul of the AML/CFT framework that would redirect supervisory focus toward higher-risk customers and away from lower-risk ones. FDIC Chair Travis Hill said in a statement that banks currently channel much of their resources into complying with BSA requirements, despite it being unclear whether or not that effort translates to advancements in law enforcement or national security efforts. Hill added that the risk of large fines for BSA violations serves as an incentive for banks to deny or close customers’ accounts. The FDIC Board approved the stablecoin AML proposal unanimously, 3-0. The public has 60 days to comment on the rule after it is published. If you're reading this, you’re already ahead. Stay there with our newsletter .
23 May 2026, 17:10
Bitcoin Faces Fresh Selling as ARMA Bill Lacks 1 Million BTC Mandate

Bitcoin fell from May 22 to May 23 and slipped below the ¥12 million level. The ARMA bill would create a Strategic Bitcoin Reserve, but reports said it lacks a firm 1 million BTC purchase mandate. Options data showed the put-call ratio rising to 100.62, pointing to stronger hedging demand. Bitcoin entered the weekend under pressure after policy expectations cooled and market data showed heavier selling across spot and derivatives venues. The move pushed BTC below ¥12 million , a key psychological level for Japanese traders, while dollar-based charts showed price hovering near the mid-$75,000 zone. Recent market data breaks down the Japanese market report, the ARMA disappointment, Trump Media-related transfer concerns, and the warning signs appearing in futures and options data as traders watch the next U.S. macro and crypto policy dates. Policy Hopes Fade as Bi… Read The Full Article Bitcoin Faces Fresh Selling as ARMA Bill Lacks 1 Million BTC Mandate On Coin Edition .
23 May 2026, 17:02
Pundit to XRP Holders: Congratulations, You’re About to Get Rich. Here’s why

A major leadership transition at the United States Federal Reserve is quickly becoming part of the latest bullish narrative surrounding XRP. As Jerome Powell officially stepped down as Chair of the Federal Reserve and Kevin Warsh assumed the role, reactions from the cryptocurrency community immediately followed. Among the most notable responses came from crypto analyst Steph Is Crypto, who delivered a bold message to XRP holders in a post on X. The analyst wrote, “Congratulations, XRP holders. You’re about to get rich. Bye-bye, Jerome.” The short statement connected growing optimism around XRP with the end of Powell’s leadership at the central bank. For many digital asset investors, the transition signals the possibility of a different monetary environment that could favor cryptocurrencies after years of tight financial conditions. Congratulations $XRP holders. You're about to get rich. Bye bye Jerome pic.twitter.com/GSjLJOZtgi — STEPH IS CRYPTO (@Steph_iscrypto) May 22, 2026 Shift Away From Powell Era Powell’s years as Chair were characterized by aggressive interest rate hikes, inflation control, and tighter financial conditions. Those policies often created pressure on speculative assets, including cryptocurrencies. However, Powell’s exit as Chair does not mean a complete departure from the Federal Reserve system. In an unusual decision, Powell chose to remain on the Federal Reserve Board of Governors, where his term continues until January 2028. That decision has introduced another layer of political and institutional tension within the central bank. Traditionally, outgoing Fed Chairs resign entirely to allow the incoming administration and new leadership to reshape the institution. Many analysts interpreted Powell’s decision to stay as an effort to maintain institutional independence and prevent rapid political influence over monetary policy decisions. For crypto investors, the development has added to ongoing conversations about confidence in traditional financial systems. Some XRP supporters view the internal dynamics at the Federal Reserve as another example of why decentralized and blockchain-based financial technologies continue to attract attention globally. XRP Community Continues to Watch Macro Developments The XRP market has remained closely tied to broader macroeconomic conditions over the past several years. Interest rate decisions , liquidity expectations, and Federal Reserve commentary have all influenced investor sentiment toward digital assets. Steph Is Crypto’s post appeared to capture expectations that the transition from Powell to Warsh could eventually lead to a softer monetary environment. Lower interest rates or less restrictive policy conditions are often viewed as supportive for cryptocurrencies because they can increase liquidity and investor appetite for higher-risk assets. We are on X, follow us to connect with us :- @TimesTabloid1 — TimesTabloid (@TimesTabloid1) June 15, 2025 The analyst’s confident tone also reflected continued bullish sentiment within the XRP community . Many holders believe XRP could benefit not only from improving market conditions but also from growing institutional interest in blockchain-based payment infrastructure and cross-border settlement technology. XRP Narrative Expands Beyond Price Speculation Although the X post focused on the possibility of major financial gains for XRP holders , the timing of the message linked the asset to a broader narrative involving monetary policy, institutional power, and financial system evolution. The Federal Reserve transition has become more than a political story for many digital asset investors. Instead, it represents ongoing friction within the traditional financial structure. Against that backdrop, supporters of XRP and other cryptocurrencies continue positioning blockchain assets as alternatives capable of operating outside conventional banking limitations. Disclaimer : This content is meant to inform and should not be considered financial advice. The views expressed in this article may include the author’s personal opinions and do not represent Times Tabloid’s opinion. Readers are advised to conduct thorough research before making any investment decisions. Any action taken by the reader is strictly at their own risk. Times Tabloid is not responsible for any financial losses. Follow us on X , Facebook , Telegram , and Google News The post Pundit to XRP Holders: Congratulations, You’re About to Get Rich. Here’s why appeared first on Times Tabloid .


