


News
1 Jun 2026, 07:30
Powell Warns the Federal Reserve Won’t Survive if a President Can Fire Officials Over Policy
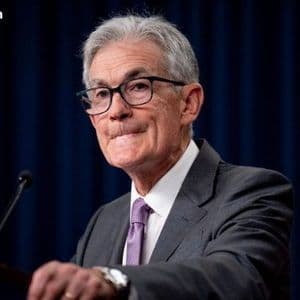
Former Federal Reserve chair Jerome Powell says the U.S. central bank would lose the credibility it needs to steady the economy if officials could be removed over policy disagreements. The warning landed as the Supreme Court weighs President Donald Trump’s effort to fire Governor Lisa Cook. A Direct Defense of Central Bank Independence Powell delivered
1 Jun 2026, 07:30
Solana Co-Founder Yakovenko Calls For New SOL Disinflation Push

Solana co-founder Anatoly Yakovenko has called for another attempt to accelerate SOL disinflation, after a new GitHub discussion proposed improving Solana’s tokenomics through a resource-based base fee that would be fully burned. The debate puts SOL issuance, fee burn mechanics and validator economics back at the center of Solana governance after last year’s failed SIMD-0228 vote. The exchange began with a post from pseudonymous Solana researcher Dr Cavey phd, who wrote, “MSTHDA(FTFT): make SOL $300 again (for the first time). discuss.” Helius CEO Mert Mumtaz replied, “do it,” while Yakovenko added a simple “+1.” Vibhu Norby, Solana Foundation Chief Product Officer and Interim CMO, responded with an eyes emoji. SIMD-0547 Puts Solana Burn Mechanics Back In Focus The discussion was opened with a May 30 GitHub post by dr cavey phd under the title “Improving SOL tokenomics via a resource-based base fee.” The SIMD-0457 argues that Solana’s current burn is too small to give SOL meaningful exposure to network activity. “Presently, the SOL burn on the network is incredibly tiny and insignificant,” the post said. “At a throughput of 3000 TPS, or 259M Tx/day, the 2500 base fee burn results in 648 SOL burned per day. If you isolate this to only nonvotes, this is even smaller.” The author rejected a simple across-the-board base fee increase, arguing it would hit the wrong parts of the network. Retail users and searchers often pay priority fees far above the base signature fee, while validators and market makers send high transaction volumes where the base fee is a larger share of cost. “So, increasing the base fee outright and uniformly would threaten decentralization,” the post said, citing pressure on validator profitability, and would also threaten Solana’s spot market structure by increasing market maker fixed costs. Instead, the proposal calls for a resource-based base fee that would be entirely burned. Each Solana transaction already has a cost profile based on compute units, data loaded, write locks and other variables. The suggested mechanism would charge and burn 0.1 lamport per cost unit requested, with the author saying the figure was chosen to avoid materially increasing costs for market makers, whose oracle updates typically request fewer than 2,500 cost units. The proposal’s examples show sharply different effects depending on transaction type. A Shekel-to-SOL swap via OKX would rise from a 5,000 base fee plus 130,980 priority fee to include an additional 82,432 new burned base fee, a 60% increase. A SOL-to-TRANSCEND transaction via Pump with no priority fee would see costs rise 639%. A USDC-to-99% transaction via DFlow with a large priority fee would rise only 2%, while a Zerofi oracle update would rise 3%. The draft estimated that, assuming most blocks request 50 million to 300 million total cost units, the mechanism could burn roughly 1,080 to 6,480 SOL per day, with the author’s “hunch” closer to 2,160 SOL per day. That would come on top of the current roughly 648 SOL daily base-fee burn, but still sit well below estimated inflation of about 60,000 SOL per day. Commenters immediately focused on whether the proposed burn would be large enough to matter. One reply argued the aggregate estimate needed tighter empirical support, while another provided recent requested compute-unit data suggesting current usage could put the burn in the 1,500 to 1,800 SOL per day range. Another commenter warned that, with Solana inflation still around 3.8%, the mechanism would deflate only about 0.1% at current requested units and would need roughly 10 times current demand to approach 1% deflation, assuming fee demand did not taper. SIMD-0411 Revives Solana’s Failed Disinflation Debate Yakovenko’s own response came after the discussion moved to X. Dr. Cavey later shared a meme saying, “I want you to improve the monetary policy of SOL,” quoting trader Ansem’s view that SOL could lead again with more breakout apps and improved monetary policy. Yakovenko replied: “Make another simd to double the disinflation rate.” Helius CEO Mert Mumtaz answered that the ecosystem “already” has one, pointing to SIMD-0411 . SIMD-0411 proposes increasing Solana’s disinflation rate from 15% to 30%, accelerating the decline in SOL issuance while leaving the terminal inflation rate at 1.5%. Its authors model the change as bringing Solana to terminal inflation in 3.1 years, around early 2029, rather than 6.2 years, around early 2032. They estimate a reduction of 22.3 million SOL in emissions over six years, or about 3.2% lower supply than under the current path. The proposal is intentionally simpler than SIMD-0228, which failed in March 2025. SIMD-0228 sought to introduce a market-based emissions model tied to staking participation, but it did not clear Solana’s two-thirds approval threshold . It received roughly 61.6% support, short of the 66.67% required, despite participation from about 74% of staked SOL across 910 validators. The failure was not due to indifference. It reflected a split over who bears the cost of lower emissions. Supporters said Solana was overpaying for security and diluting SOL holders. Opponents, especially smaller validators, warned that a sharp cut to staking rewards could weaken validator economics and pressure decentralization. That history now frames the new debate: Solana’s next tokenomics push may need to combine lower issuance or higher burn with a credible answer for validator sustainability. At press time, SOL traded at $81.41.
1 Jun 2026, 07:05
EUR/JPY Price Forecast: Pair Slips from Upper Descending Channel Boundary Near 186.00

BitcoinWorld EUR/JPY Price Forecast: Pair Slips from Upper Descending Channel Boundary Near 186.00 The EUR/JPY cross edged lower during Wednesday’s trading session, pulling back from the upper boundary of a descending channel near the 186.00 level. The move suggests sellers are defending the channel’s top, keeping the broader bearish structure intact for now. Technical Setup: Descending Channel in Focus The pair has been trading within a clearly defined descending channel since mid-March, with each rally finding resistance at the upper trendline. Wednesday’s rejection from the 186.00 area—coinciding with the channel’s top—reinforces the pattern’s validity. A sustained break above this level would be needed to signal a potential trend shift, while a move lower could open the path toward the channel’s lower boundary near 183.50. The 14-day Relative Strength Index (RSI) sits near 52, indicating neutral momentum without overbought or oversold extremes. This leaves room for either direction, though the descending channel bias remains bearish until broken. Key Levels to Watch Immediate support is seen at 185.00, a psychological round number and prior intraday pivot. Below that, the 184.50 area marks the 50-day moving average, which has provided support during recent pullbacks. On the upside, resistance at 186.00 is reinforced by the channel top, followed by the 186.50 level from early April highs. Traders should monitor for a daily close above 186.00 to suggest the channel breakout may be underway, potentially targeting 187.50. Conversely, a drop below 184.50 would confirm sellers remain in control, with the next support at 183.50. Market Context and Implications The EUR/JPY pair is sensitive to diverging monetary policy expectations between the European Central Bank and the Bank of Japan. Recent comments from ECB officials hinting at a potential rate hold in June have provided some support for the euro, while the yen remains under pressure from the BOJ’s ultra-loose stance. However, the descending channel suggests that the broader trend favors yen strength, possibly reflecting safe-haven flows amid global growth concerns. For forex traders, the channel’s upper boundary near 186.00 offers a clear risk-reward setup: a short position with a stop above the recent high, targeting the channel’s lower end. Breakout traders, meanwhile, are watching for a confirmed close above resistance to shift to a bullish bias. Conclusion The EUR/JPY price action remains constrained by the descending channel, with the 186.00 level acting as a critical resistance. Until a decisive breakout occurs, the technical bias favors selling into rallies. Traders should watch for a close above 186.00 to invalidate the bearish view, or a break below 184.50 to accelerate downside momentum. FAQs Q1: What is a descending channel in forex trading? A descending channel is a bearish chart pattern formed by two parallel downward-sloping trendlines. The upper line connects lower highs, while the lower line connects lower lows. It indicates that sellers are in control, and prices are likely to continue falling until the pattern is broken. Q2: Why is the 186.00 level important for EUR/JPY? The 186.00 level is significant because it coincides with the upper boundary of the descending channel. It also represents a psychological round number and a prior resistance zone from early April. A sustained break above this level would suggest a potential trend reversal. Q3: What factors could break the EUR/JPY descending channel? A breakout could be triggered by a shift in monetary policy expectations, such as a more hawkish ECB or a less dovish BOJ. Strong eurozone economic data, geopolitical developments reducing safe-haven demand for the yen, or a broad dollar move could also push the pair above resistance. This post EUR/JPY Price Forecast: Pair Slips from Upper Descending Channel Boundary Near 186.00 first appeared on BitcoinWorld .
1 Jun 2026, 06:59
Here’s Why Bitcoin (BTC) Could Still Face Its Biggest Crash Ahead: Analyst

Bitcoin (BTC) has remained under pressure over the past week, falling from around $77,000 to approximately $73,140. The crypto asset experienced several sharp declines during the period, including a notable drop near $72,600 on May 28. The latest price action suggests that the bear market remains unfinished and that deeper losses may lie ahead before recovery begins. ‘Stage 5 Is Coming’ In his latest weekly report, Doctor Profit said the market’s broader structure has not changed and that Bitcoin is still progressing through the later stages of a bear market. According to the analyst, this stage is characterized by exhaustion, sideways trading, and growing frustration among market participants. He said these conditions are already evident in Bitcoin’s recent price action and believes they signal the market is approaching a transition to Stage 5, which he identifies as the true capitulation phase of the cycle. Doctor Profit expects Stage 5 to begin once Bitcoin falls below $60,000. A break of that level is expected to accelerate panic across the market and trigger a more severe downturn. He added that the next phase could see forced selling by long-term holders, the collapse of a major exchange or a large market participant, or other black swan-type events that further weaken investor confidence. The analyst argued that bear markets rarely unfold in a straight line and instead tend to be lengthy, exhausting, and destructive for participants, which is why he believes many investors continue to underestimate the downside risks. Despite Bitcoin’s decline from its highs, Doctor Profit does not believe the market has reached its final bottom. He continues to predict that Bitcoin will eventually fall into the $40,000-$50,000 region before the bear market concludes. Based on his calculations, he sees September to October 2026 as the most likely period for that bottom to form. The analyst also pointed to several upcoming US economic data releases, such as ISM Manufacturing PMI, ADP employment figures, and nonfarm payrolls, as important events for financial markets. He explained that any signs of weakness in employment data combined with persistent inflation would place the Federal Reserve in a difficult position. Looking ahead to the June Federal Open Market Committee meeting under Chair Kevin Warsh, the analyst said markets appear to be pricing in a dovish policy stance, but he remains skeptical that such an outcome will materialize. Derivatives Market Still Struggles Another factor supporting a similar outlook is the current state of the Bitcoin derivatives market. According to another analyst, Darkfost, the sector has yet to fully recover from the massive liquidation event on October 10, when nearly 71,000 BTC were wiped from open interest across major exchanges within hours. While activity has improved since then, total open interest across the Bitcoin derivatives market, excluding CME, remains below pre-liquidation levels, with roughly 351,000 BTC currently outstanding, down from nearly 375,000 BTC before the event. However, Binance has bucked the trend, increasing both its open interest and market share since October. Such a trend could potentially indicate that trading activity has become increasingly concentrated on the exchange as investors gravitate toward deeper liquidity and market depth. The post Here’s Why Bitcoin (BTC) Could Still Face Its Biggest Crash Ahead: Analyst appeared first on CryptoPotato .
1 Jun 2026, 06:57
Citi predicts the tokenized securities market will grow to $5.5 trillion by 2030

Stablecoins alone will generate a demand for up to $1 trillion worth of onchain U.S. Treasury bills and $2.6 trillion for tokenized stocks, said Citi.
1 Jun 2026, 06:50
Indian Rupee Extends Gains at the Start of RBI Policy Week
BitcoinWorld Indian Rupee Extends Gains at the Start of RBI Policy Week The Indian rupee continued its upward trajectory against the US dollar on Monday, extending gains at the start of a week that will be dominated by the Reserve Bank of India’s (RBI) monetary policy decision. The currency opened stronger, supported by a softer dollar overseas and expectations that the central bank may signal a more accommodative stance. Rupee Movement and Market Context The domestic currency appreciated to a session high of 83.45 against the greenback, compared to its previous close of 83.62. Traders attributed the move to a combination of factors, including a pullback in the dollar index and optimism around foreign portfolio inflows into Indian equities. The rupee’s gains come after a period of relative stability, with the currency trading in a narrow band over the past few weeks. The RBI’s monetary policy committee (MPC) is scheduled to begin its three-day meeting on Tuesday, with the decision due on Thursday. Market participants widely expect the central bank to hold the repo rate steady at 6.50% for the eighth consecutive meeting, but the focus will be on the tone of the commentary and any forward guidance on liquidity management. What the RBI Policy Means for the Rupee The RBI’s policy stance is a critical determinant for the rupee’s near-term direction. A hawkish hold, emphasizing inflation risks, could support the rupee by attracting foreign capital. Conversely, a dovish tilt, hinting at future rate cuts, might weigh on the currency by reducing the interest rate differential with the US. Analysts note that the central bank’s active intervention in the forex market has been a key factor in preventing sharp volatility. The RBI has been selling dollars to curb excessive depreciation and absorbing inflows to prevent a rapid appreciation, maintaining a managed float. The upcoming policy statement will provide clues on whether the central bank intends to continue this approach. Global Factors and Dollar Dynamics On the global front, the dollar index eased from recent highs as markets digested mixed US economic data and growing expectations of a Federal Reserve rate cut in September. A weaker dollar reduces pressure on emerging market currencies, including the rupee. Additionally, a decline in crude oil prices, which have eased from multi-month highs, has provided further support to the rupee, as India is a major importer of oil. The interplay between domestic policy signals and global risk appetite will likely dictate the rupee’s trajectory in the coming days. Traders are also monitoring geopolitical developments and their impact on capital flows. Conclusion The Indian rupee’s gains at the start of the RBI policy week reflect a confluence of favorable global cues and domestic expectations. While the immediate focus is on the MPC’s decision and commentary, the broader trend for the currency will depend on the sustainability of foreign inflows, the trajectory of the dollar, and the RBI’s management of liquidity. The policy outcome on Thursday will be a key inflection point for the rupee’s near-term path. FAQs Q1: Why is the Indian rupee gaining against the US dollar? The rupee is gaining due to a softer US dollar overseas, expectations of a dovish RBI policy, and improved foreign investor sentiment towards Indian markets. Lower crude oil prices have also supported the currency. Q2: What is the RBI’s monetary policy decision expected this week? The RBI is widely expected to keep the repo rate unchanged at 6.50%. However, the market will closely watch the central bank’s commentary on inflation, growth, and liquidity management for future policy signals. Q3: How does the RBI policy affect the rupee? The RBI’s policy stance influences the rupee through interest rate differentials, capital flows, and intervention in the forex market. A hawkish stance tends to support the rupee, while a dovish stance can weaken it. The central bank also directly intervenes to manage volatility. This post Indian Rupee Extends Gains at the Start of RBI Policy Week first appeared on BitcoinWorld .


