


News
9 Jun 2026, 08:30
Bitcoin Near $63.5K Is Hovering at What It Costs to Mine BTC, Leaving Miners at Break-Even
Bitcoin is changing hands near $63,500, a level analyst Charles Edwards says lines up with the network’s average production cost, i.e. the threshold where the typical miner stops turning a profit. Miners Squeezed to the Break-Even Line The recent selloff has dragged bitcoin back to a price band that has historically marked long-term value. In
9 Jun 2026, 08:00
LBank Launches "Super League" Campaign with a $5,000,000 USDT Prize Pool

Singapore, Singapore, June 9th, 2026, Chainwire LBank , a leading global cryptocurrency exchange, has officially launched Super League , a global trading and prediction campaign featuring a total reward pool of 5,000,000 USDT. Running from June 9 to July 20, the event combines trading, prediction markets, gamified challenges, and community participation, giving users multiple ways to earn rewards while celebrating the excitement of the world's biggest football tournament. Participants can earn points, puzzle fragments, and lottery entries through trading, deposits, referrals, and interactive platform activities. Rewards include a 1,000g Gold Ball, FIFA World Cup 2026 Final Tickets, BTC, ETH, FIFA WC26 Jerseys, and numerous premium prizes available throughout the campaign. The Super League campaign is designed around four interactive modules that reward users for both trading activity and ecosystem engagement. 1. Match Prediction Participate in market predictions and reach a trading volume of 500–5,000 USDT to unlock 5–20 points on a tiered basis. 2. Puzzle Collection Complete tasks including spot and futures trading, copy trading, OTC deposits, and bullet comment interactions to earn fragments and points. Participants can earn up to 350 points, while users who successfully collect all nine puzzle fragments will qualify to share an exclusive reward pool. 3. Penalty Shootout Inspired by football's most thrilling moments, the Penalty Shootout module allows users to earn lottery entries through spot trading, futures trading, referrals, fiat purchases, copy trading, wealth management products, and grid trading. Users can accumulate up to 61 lottery opportunities, with rewards including BTC, ETH, FIFA WC26 jerseys, and other exclusive prizes. 4. Points Leaderboard The campaign features both a Daily Leaderboard and a Total Leaderboard. The Daily Leaderboard rewards the top 100 users each day with a share of 4,200 points, based on daily accumulated scores. The total Leaderboard ranks users by total points earned throughout the campaign. The top 200 participants will share a $200,000 USDT reward pool, with the highest-ranking user eligible to receive rewards worth up to $35,000 USDT. Eric He, LBank's Community Angel Officer and Risk Control Adviser, stated: "The Super League is more than a trading campaign — it's a celebration of our community. We've designed this event to reward users at every level, from casual traders to power users, and we're excited to combine the energy of the World Cup with the excitement of crypto. This is our way of giving back to the millions of users who make LBank what it is today." The launch of Super League comes as LBank continues expanding its ecosystem beyond traditional exchange services. In recent months, the platform has accelerated its investment in prediction markets, AI-powered trading tools, social trading experiences, and community-driven engagement products. By integrating prediction markets, gamified reward systems, and real-world events into a unified experience, LBank aims to redefine how users interact with digital assets and participate in emerging narratives. About LBank Founded in 2015, LBank is a leading global cryptocurrency exchange serving over 25 million registered users in 160 countries and regions. With a daily trading volume exceeding $10.5 billion and 10 years of safety with zero security incidents, LBank is dedicated to providing a comprehensive and user-friendly trading experience. Through innovative trading solutions, the platform has enabled users to achieve average returns of over 130% on newly listed assets. LBank has listed over 300 mainstream coins and more than 50 high-potential gems. Ranked No. 1 in 100x Gems, Highest Gains, and Meme Share, LBank leads the market with the fastest altcoin listings, unmatched liquidity, and industry-first trading guarantees, making it the go-to platform for crypto investors worldwide. Users Can Follow LBank for Updates Website: https://www.lbank.com/ Twitter: https://twitter.com/LBank_Exchange Telegram: https://t.me/LBank_en Instagram: https://www.instagram.com/lbank_exchange LinkedIn: https://www.linkedin.com/company/lbank For media requests, users can contact: Email: [email protected] ContactPR & Communications [email protected] Disclaimer: This is a sponsored press release and is for informational purposes only. It does not reflect the views of Crypto Daily, nor is it intended to be used as legal, tax, investment, or financial advice.
9 Jun 2026, 05:12
Bitcoin Holds $63K as Miner Says Strategy Survives $30K, Trump Ceasefire Fails to Move BTC

Bitcoin News Jiang Zhuoer, chief executive of mining pool BTC.TOP, argued that Bitcoin could fall as low as $30,000 without forcing Strategy to abandon its accumulation plans. Writing over the week...
9 Jun 2026, 04:55
Chinese mining CEO says Strategy can survive a $30,000 bitcoin without selling

Jiang Zhuoer of BTC.TOP called the week's sell-off speculation overblown, arguing Strategy's small debt and the design of its preferred shares let it keep buying.
9 Jun 2026, 02:25
Humanity CEO Confirms $20M Hack Stemmed From Leaked Private Key of Foundation Member

BitcoinWorld Humanity CEO Confirms $20M Hack Stemmed From Leaked Private Key of Foundation Member Terence Kwok, the CEO of the decentralized identity protocol Humanity (H), has confirmed that the recent $20 million exploit of the platform originated from a leaked private key belonging to a foundation member. The admission, made in a public statement, marks a significant development in the ongoing investigation into the security breach that has shaken user confidence in the project. Leaked Key Led to Major Exploit According to Kwok, the compromised private key allowed the attacker to gain unauthorized access to the project’s bridge and associated liquidity pools. The breach, which was first detected earlier this week, resulted in the loss of approximately $20 million in various crypto assets. Kwok did not specify which foundation member’s key was leaked or how the leak occurred, but he assured the community that a full forensic audit is underway. Immediate Security Measures Enforced In response to the incident, the Humanity foundation has issued an urgent advisory urging all users to immediately cease using the project’s bridge and any connected liquidity pools. The foundation stated that these measures are precautionary until a comprehensive security review can be completed and the integrity of the affected systems can be verified. Users have been warned that any transactions involving the bridge or pools carry a high risk of loss. Broader Implications for Cross-Chain Security The Humanity hack underscores a persistent vulnerability in the decentralized finance (DeFi) space: the reliance on private keys for critical infrastructure. Security experts have long warned that the compromise of a single key, particularly one held by a project insider, can lead to catastrophic losses. This incident is likely to intensify calls for more robust key management practices, including the use of multi-signature wallets, hardware security modules, and decentralized key sharding. The breach also highlights the risks associated with cross-chain bridges, which have become a prime target for attackers due to the concentration of value they represent. Conclusion The confirmation of a leaked private key as the root cause of the Humanity hack provides clarity on the attack vector but raises serious questions about internal security protocols at the foundation. As the project works to contain the damage and restore trust, the wider crypto community will be watching closely to see what measures are implemented to prevent a recurrence. For now, users are advised to follow the foundation’s guidance and avoid using the bridge and liquidity pools until a full security clearance is given. FAQs Q1: What exactly happened in the Humanity hack? A1: An attacker gained unauthorized access to Humanity’s bridge and liquidity pools by using a leaked private key belonging to a foundation member, resulting in the theft of approximately $20 million in crypto assets. Q2: What should Humanity users do right now? A2: The foundation has advised all users to immediately stop using the bridge and all liquidity pools until a full security review is completed and the systems are deemed safe. Q3: How common are private key leaks in crypto? A3: While not everyday occurrences, private key leaks are a known and serious security risk in the crypto space. They have led to several high-profile hacks, often targeting bridges and custodial wallets, and underscore the need for advanced key management solutions. This post Humanity CEO Confirms $20M Hack Stemmed From Leaked Private Key of Foundation Member first appeared on BitcoinWorld .
9 Jun 2026, 01:00
Bitcoin Crash To $30,000? China Mining Giant Says Strategy Can Survive

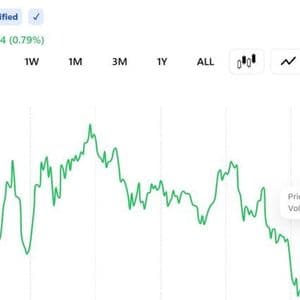
Jiang Zhuoer, CEO of BTCTOP and one of China’s best-known Bitcoin mining figures, pushed back against fears that Strategy could become a major forced seller of BTC, arguing that the company’s balance-sheet risk remains manageable even under a severe Bitcoin drawdown. In a post on X, Jiang said he does not believe MicroStrategy, now Strategy, will “substantially net sell BTC,” pointing to a group discussion he shared on the company’s liabilities, STRC interest payments, funding structure and market concerns. The comments come as investors debate whether Strategy’s Bitcoin-backed capital markets model could come under pressure if BTC weakens further or if demand for STRC remains fragile. Bitcoin Panic Over Strategy Overblown? At the center of Jiang’s argument is the distinction between selling some Bitcoin and becoming a net seller of Bitcoin. He argued that a limited sale of older, low-cost BTC could be used to demonstrate realized investment gains, support STRC-related payments and reassure traditional investors without changing the broader accumulation strategy. Related Reading: Bitcoin’s “Electrical Cost” Suggests Possible Bear Market Floor Near $50,000 — Analyst “MicroStrategy will not significantly net-sell its coins,” the translated group discussion stated. “He already explained the reason for the last coin sale in an interview. He wanted to sell STRC.” According to the discussion, Strategy’s logic rests on the assumption that Bitcoin’s long-term appreciation can support the cost of STRC funding. The message attributed the thesis to a calculation that BTC can compound at around 30% annually, while using roughly 10% to pay interest would still leave sufficient room for the strategy to work. The concern, however, is not simply whether Strategy owns enough Bitcoin. It is whether the firm’s financing structure looks credible to traditional investors. The discussion framed the market’s core worry bluntly: if later STRC proceeds are used to pay earlier STRC interest, critics could view the model as resembling a Ponzi-like funding loop. That is why, in Jiang’s view, selective Bitcoin sales may be necessary rather than alarming. Selling some of the earliest and cheapest BTC would allow Strategy to show accounting gains. Those gains could then be used to pay STRC interest, while newly raised STRC proceeds are deployed into additional Bitcoin purchases. If the new BTC purchases are several times larger than the old BTC sold, Jiang argued, Strategy remains a net buyer. “So MicroStrategy has to sell some of the earliest and cheapest Bitcoin it bought,” the translated discussion said. “That way, accounting-wise, it can show investment gains. Then using the investment gains from selling Bitcoin to pay STRC interest becomes completely reasonable.” Related Reading: Bitcoin’s Great Wealth Transfer May Fuel Next Rally, Says CryptoQuant CEO Jiang also pushed back against fears that Strategy’s liabilities could spiral if STRC trades below par. He said the current debt-to-asset ratio is only about 5%, and characterized STRC’s discount as a short-term market sentiment issue rather than a sign of insolvency risk. In the worst case, he argued, several months of continued payments could restore confidence in the instrument. The discussion used a real estate analogy to explain the point. If a borrower owns $10 billion of houses and has borrowed $500 million, lenders may still worry if the borrower insists the houses can never be sold. But if the borrower shows willingness to sell one house to cover interest, the risk profile changes. “After all, I have 10 billion worth of houses, and I only borrowed 500 million,” the translated message said. “As long as I’m willing to sell houses, there absolutely won’t be a situation where I can’t repay 500 million. That is why MicroStrategy has to start selling coins: to borrow more money and buy more coins.” Jiang’s argument also distinguishes STRC holders from Bitcoin holders. In his view, STRC buyers are not primarily betting on BTC upside; they care whether Strategy is willing and able to pay dividends. If the company shows that it can monetize BTC when needed, that may reduce the biggest concern among STRC investors. At press time, BTC traded at $63,468. Featured image created with DALL.E, chart from TradingView.com


