


News
23 Mar 2026, 11:05
USD/INR Shatters Records: Middle East Conflicts Devastate Indian Rupee in 2025 Currency Crisis

BitcoinWorld USD/INR Shatters Records: Middle East Conflicts Devastate Indian Rupee in 2025 Currency Crisis The USD/INR currency pair has shattered all previous records, reaching unprecedented highs as escalating Middle East conflicts severely weaken the Indian Rupee. This dramatic development, recorded on March 15, 2025, marks a significant turning point for India’s currency markets and broader economic stability. Consequently, financial analysts worldwide are closely monitoring the situation. The Indian Rupee’s rapid depreciation against the US Dollar reflects complex geopolitical tensions and their immediate economic consequences. Furthermore, this currency movement signals potential challenges for India’s import-dependent economy and foreign investment climate. USD/INR Exchange Rate Reaches Historic Peak The USD/INR pair surged to 85.47 during Asian trading hours, surpassing the previous record of 84.48 set in October 2022. This represents a 3.2% weekly decline for the Indian Rupee, marking its worst performance since September 2023. Meanwhile, the Reserve Bank of India has reportedly intervened in currency markets to stabilize the situation. Historical data reveals this as the most significant single-day movement in over eighteen months. Additionally, forward contracts indicate continued pressure on the Rupee throughout the coming quarter. Several key factors contributed to this dramatic movement. First, renewed hostilities in the Strait of Hormuz disrupted global oil shipments. Second, India’s substantial crude oil imports became significantly more expensive. Third, foreign institutional investors accelerated capital outflows from emerging markets. Fourth, safe-haven demand for US Dollars intensified globally. Finally, India’s trade deficit widened unexpectedly during the previous month. Middle East Conflict Directly Impacts Indian Economy Geopolitical tensions in the Middle East create immediate consequences for India’s economy. Specifically, approximately 85% of India’s crude oil imports transit through affected regions. Therefore, shipping insurance premiums have increased by 40% since January 2025. Simultaneously, alternative shipping routes add 15-20% to transportation costs. These developments directly increase India’s import bill and current account deficit. The conflict’s economic impact extends beyond energy markets. For instance, approximately 8.9 million Indian expatriates work in Gulf Cooperation Council countries. Consequently, remittance flows face potential disruption. Moreover, India’s substantial exports to the region, valued at $58 billion annually, encounter new logistical challenges. Regional trade partners are experiencing similar economic pressures. Expert Analysis of Currency Market Dynamics Financial institutions provide detailed assessments of the situation. According to Standard Chartered’s emerging markets report, “The Indian Rupee faces triple pressure from geopolitics, commodities, and capital flows.” Similarly, Nomura Holdings analysts note, “India’s external balances remain vulnerable to oil price shocks despite improved reserves.” These expert perspectives highlight systemic risks beyond immediate currency movements. Historical comparisons reveal important patterns. During the 2019 Gulf tensions, USD/INR appreciated 2.1% over three weeks. However, the 2025 movement shows greater velocity and magnitude. Central bank interventions during previous crises provide relevant precedents. The Reserve Bank of India deployed $12.3 billion in October 2022 to support the currency. Current foreign exchange reserves stand at $612 billion, offering substantial defensive capacity. Global Currency Markets Experience Parallel Movements Other emerging market currencies demonstrate similar patterns. The Indonesian Rupiah declined 1.8% against the US Dollar this week. Meanwhile, the Philippine Peso weakened 2.1% during the same period. These parallel movements indicate broader regional vulnerability to geopolitical shocks. Developed market currencies show contrasting behavior. The Swiss Franc and Japanese Yen both gained as traditional safe havens. The US Dollar Index (DXY) strengthened to 105.8, its highest level since November 2024. This reflects global risk aversion and Federal Reserve policy expectations. European currencies face their own challenges. The Euro declined 0.9% against the Dollar amid regional economic concerns. These interconnected movements create complex trading environments. Economic Consequences for Indian Businesses and Consumers Import-dependent industries face immediate cost pressures. Automobile manufacturers report 4-6% increases in component costs. Pharmaceutical companies experience similar raw material price increases. Consumer goods companies anticipate margin compression. Export-oriented sectors see potential benefits from currency depreciation. Information technology services may gain competitive pricing advantages. Textile exporters could increase market share in price-sensitive segments. Indian consumers encounter rising prices for essential goods. Fuel prices increased 5.3% this month alone. Cooking oil costs rose 4.1% during the same period. Transportation expenses show similar upward trends. Household budgets face growing pressure across multiple categories. The wholesale price index increased 3.8% year-over-year in February 2025. Government and Central Bank Response Strategies The Reserve Bank of India employs multiple policy tools. Foreign exchange market interventions aim to smooth volatility. Liquidity adjustment operations address banking system needs. Communication strategies manage market expectations. The government considers additional measures. Strategic petroleum reserve releases could mitigate oil price impacts. Export promotion schemes might receive enhanced funding. Import duty adjustments remain under discussion. International coordination efforts continue through multiple channels. The International Monetary Fund monitors emerging market vulnerabilities. G20 working groups discuss energy security frameworks. Bilateral arrangements with oil-producing nations receive renewed attention. These multilateral approaches complement domestic policy responses. Market Outlook and Future Scenarios Short-term projections suggest continued volatility. Technical analysis indicates potential resistance at 86.20 for USD/INR. Fundamental factors point toward persistent pressure. Medium-term scenarios depend on conflict resolution. A swift de-escalation could support Rupee recovery. Protracted tensions may extend currency weakness. Long-term structural considerations remain relevant. India’s manufacturing expansion could reduce import dependency. Export diversification might enhance external resilience. Investment flows show changing patterns. Foreign portfolio investors reduced Indian equity exposure by $1.2 billion this month. Foreign direct investment demonstrates greater stability. Domestic institutional investors provided counterbalancing support. These flow dynamics influence currency valuation beyond trade balances. Conclusion The USD/INR exchange rate reaching record highs underscores the profound impact of Middle East conflicts on global currency markets. The Indian Rupee’s depreciation reflects complex geopolitical and economic interconnections. Consequently, policymakers face challenging decisions regarding currency management and economic stability. Furthermore, businesses and consumers experience tangible consequences from these currency movements. The situation demonstrates how regional conflicts create global economic reverberations. Ultimately, the USD/INR trajectory will depend on both geopolitical developments and domestic economic fundamentals. FAQs Q1: Why is the Indian Rupee weakening against the US Dollar? The Indian Rupee faces pressure from multiple factors including Middle East conflicts disrupting oil supplies, increased import costs, foreign capital outflows, and global risk aversion boosting demand for US Dollars as a safe-haven currency. Q2: How does Middle East conflict specifically affect India’s economy? India imports approximately 85% of its crude oil through affected regions, faces increased shipping and insurance costs, risks disruption to expatriate remittances from Gulf countries, and encounters challenges for its $58 billion annual exports to the region. Q3: What is the current USD/INR exchange rate? The USD/INR pair reached 85.47 during trading on March 15, 2025, surpassing the previous record of 84.48 set in October 2022, representing a 3.2% weekly decline for the Indian Rupee. Q4: How is the Reserve Bank of India responding to the currency weakness? The Reserve Bank is intervening in foreign exchange markets to smooth volatility, utilizing its $612 billion in reserves, managing liquidity through banking operations, and employing communication strategies to guide market expectations. Q5: What are the consequences for Indian consumers and businesses? Consumers face rising prices for fuel, cooking oil, and imported goods, while import-dependent businesses experience increased costs and margin pressure, though export-oriented sectors may gain some competitive pricing advantages. This post USD/INR Shatters Records: Middle East Conflicts Devastate Indian Rupee in 2025 Currency Crisis first appeared on BitcoinWorld .
23 Mar 2026, 11:01
MACD Signals Spur Caution as Bitcoin Faces Renewed Downward Pressure

Recent MACD signals have heightened caution within the Bitcoin market. Bitcoin’s price movements have mirrored bearish MACD signals in the past months. Continue Reading: MACD Signals Spur Caution as Bitcoin Faces Renewed Downward Pressure The post MACD Signals Spur Caution as Bitcoin Faces Renewed Downward Pressure appeared first on COINTURK NEWS .
23 Mar 2026, 11:00
Gold Price Forecast: Navigating Near-Term Resistance for a Constructive 2025 Outlook
BitcoinWorld Gold Price Forecast: Navigating Near-Term Resistance for a Constructive 2025 Outlook Singapore, April 2025 – The gold market presents a complex picture for investors, according to a recent analysis from OCBC Bank. While immediate upside appears limited, the medium-term trajectory remains fundamentally constructive. This assessment hinges on a delicate balance between persistent macroeconomic headwinds and enduring safe-haven demand. Decoding OCBC’s Gold Market Analysis OCBC Treasury Research has published a detailed outlook for the precious metal. Their core thesis suggests near-term price action will likely face a ceiling. However, analysts simultaneously project a more favorable environment developing over the coming quarters. This nuanced view requires examining multiple concurrent market forces. Consequently, investors must understand the interplay between interest rates, currency movements, and geopolitical stability. Historically, gold performs inversely to real yields on U.S. Treasury bonds. The current monetary policy landscape in major economies directly influences this relationship. Furthermore, central bank buying activity has provided a significant, consistent floor for gold prices in recent years. This institutional demand represents a critical structural support often overlooked by retail investors. The Mechanics of Near-Term Resistance Several immediate factors contribute to the projected price cap. Primarily, sustained higher interest rates in the United States increase the opportunity cost of holding non-yielding assets like gold. The U.S. dollar’s relative strength also acts as a persistent headwind, as gold is predominantly priced in dollars globally. Market sentiment and positioning data from futures exchanges frequently show when bullish bets become overcrowded, often preceding short-term corrections. Key near-term constraints include: Monetary Policy: Hawkish stances from the Federal Reserve and other central banks. Dollar Index (DXY): A resilient dollar makes gold more expensive for foreign buyers. Technical Levels: Established resistance zones around previous price peaks. Risk Appetite: Periods of strong equity market performance can divert capital. Building a Constructive Medium-Term Foundation Beyond the immediate horizon, the case for gold strengthens considerably. The medium-term constructive view rests on several long-duration trends. These trends are less sensitive to daily market fluctuations and more tied to macroeconomic shifts. For instance, global debt levels continue to reach record highs, undermining confidence in fiat currencies over time. Additionally, diversification needs within sovereign wealth and pension fund portfolios continue to drive official sector purchases. Geopolitical fragmentation and ongoing trade tensions reinforce gold’s traditional role as a neutral reserve asset. The physical market, particularly demand from key consuming nations like China and India, provides a fundamental demand base. Mine supply growth has plateaued, creating a tighter physical balance. This supply-demand dynamic underpins the positive longer-term price outlook. Primary Drivers of Gold’s Medium-Term Outlook Supportive Factor Mechanism Evidence & Context Central Bank Demand Diversification away from USD/Treasuries Record net purchases for 3 consecutive years (World Gold Council data). Inflation Hedge Demand Preservation of real purchasing power Persistent above-target inflation in major economies. Geopolitical Risk Safe-haven flows during instability Elevated conflict and strategic competition metrics. Weakening USD Cycle Historical inverse correlation Projected end of Fed tightening cycle and twin deficits. Expert Perspectives and Market Context OCBC’s analysis aligns with a broader consensus among institutional researchers. Many global banks highlight a similar ‘short-term cautious, long-term optimistic’ framework. Market veterans often reference historical patterns where gold consolidates for extended periods before its next major leg higher. This consolidation phase allows weaker hands to exit and builds a stronger foundation for future appreciation. The current environment differs markedly from the 2020-2022 period. During that time, unprecedented fiscal stimulus and emergency monetary policy dominated price action. Today’s market responds to more traditional, albeit elevated, macroeconomic variables. Understanding this shift in regime is crucial for accurate forecasting. Analysts now weigh jobs data, core inflation prints, and yield curve dynamics with greater intensity. Strategic Implications for Investors in 2025 For portfolio managers and individual investors, this bifurcated outlook suggests specific strategies. A phased accumulation approach during periods of near-term weakness could prove effective. This method averages entry prices and aligns with the constructive medium-term view. Physical gold, ETFs, and mining equities each offer different risk-return profiles and correlations. Investors should monitor several key indicators for directional clues. A sustained break above the recent technical resistance zone would signal weakening near-term headwinds. Conversely, a decisive drop below major moving averages might indicate a deeper correction is underway. The commitment of traders reports and central bank gold reserve statistics provide valuable fundamental signals. Conclusion The OCBC gold analysis presents a balanced, evidence-based forecast for 2025. The precious metal faces defined near-term resistance from monetary policy and dollar strength. Nevertheless, the medium-term outlook remains constructive, supported by structural demand, geopolitical uncertainty, and macro-financial risks. Successful navigation of this market requires patience, a focus on core fundamentals, and an understanding of the shifting drivers between the short and medium term. The gold price forecast ultimately hinges on the evolving balance between these opposing forces. FAQs Q1: What does ‘near-term capped’ specifically mean for gold prices? It suggests analysts expect a defined upper limit or resistance level that prices will struggle to surpass in the coming months, due to factors like high interest rates and a strong U.S. dollar. Q2: Why is the medium-term outlook for gold considered constructive? The constructive view is based on long-term trends such as sustained central bank buying, its role as a geopolitical hedge, and underlying inflation concerns, which are expected to support prices over a 12-24 month horizon. Q3: How do U.S. interest rates affect the gold price forecast? Higher interest rates increase the ‘opportunity cost’ of holding gold, which pays no yield. This typically creates a headwind, making other yield-bearing assets relatively more attractive in the short term. Q4: What role do central banks play in the gold market today? Central banks have been net buyers of gold for years, diversifying reserves away from traditional currencies. This institutional demand creates a significant, non-speculative source of support for the market. Q5: Should investors consider gold as part of a diversified portfolio in 2025? Many analysts believe yes, due to its historical low correlation with equities and its potential to act as a hedge against currency debasement and systemic risk, especially when acquired strategically during price dips. This post Gold Price Forecast: Navigating Near-Term Resistance for a Constructive 2025 Outlook first appeared on BitcoinWorld .
23 Mar 2026, 11:00
Bitcoin Price Holds $68,500 as Gold Extends Nine-Day Slide and Asian Stocks Drop

Gold is crashing. Equities are bleeding. Bitcoin price does not care. BTC is trading at $68,500, up 1.5% in 24 hours while gold logs its ninth straight daily loss, dropping to around $4,360. Asian equities fell for a third consecutive session, pushing major indices toward correction territory. Everything is selling off at once. Traditional safe havens and risk assets are getting hit simultaneously. Bitcoin is holding its ground anyway. BTC Stability: Bitcoin is up 1.5% daily, firmly holding the $66,000 floor that has withstood every war-driven sell-off since February 28. Gold Slide: Prices have collapsed to $4,360 in a nine-day losing streak, the asset’s longest consecutive decline in years. Asian Equities: Stocks dropped for a third session as climbing bond yields signal central banks may favor rate hikes over cuts. Bitcoin Price Analysis: Can BTC Hold Support at $68,500? Buyers are defending $68,500 hard. Price has been range-bound but constructive, bouncing off the $66,000 floor that has held through the entire Iran conflict. Losing that level and $62,000 opens up, which kills the decoupling thesis entirely. To flip the bias bullish, price needs to reclaim $70,000 and close above the range high. Bitcoin (BTC) 24h 7d 30d 1y All time Derivatives are telling an interesting story. Alexander Blume, CEO of Two Prime, says BTC derivatives have held up well given the backdrop. His firm is positioning for higher funding rates, which means smart money is betting on an upside surprise, not a breakdown. Whales are absorbing sell pressure from short-term speculators around these exact levels. Until $66,000 breaks, the trend is sideways to bullish. Gold Price Nine-Day Losing Streak: What Is Driving the Slide? Gold is in freefall. Down to roughly $4,360, shedding around 18% from recent highs and logging its longest losing streak in years. This is not how gold is supposed to behave during a geopolitical crisis. The safe haven playbook is broken. Rising bond yields and a strengthening dollar are driving the sell-off. War in the Middle East is escalating and gold is still dropping. Tether Gold (XAUT) 24h 7d 30d 1y All time The institutional buying that fueled the earlier rally is gone. Alexander Blume points out that the move up was structural, driven by China decoupling from the dollar. That bid has evaporated as liquidity becomes the priority over safety. With the Fed now pressured to hike rather than cut to fight war-stoked inflation, the cost of holding a non-yielding asset like gold has spiked. Bears are eyeing $4,300 next. The breakdown is confirmed until price proves otherwise. Asian Equities and the Risk-Off Context Asian stocks are down for a third straight session. S&P and European futures point to more losses. Risk-off sentiment is global. Bitcoin is not following. Crypto usually trades like a high-beta tech stock in environments like this, selling off hard and fast. Not today. BTC is holding green while everything else bleeds, and the divergence is showing up across the crypto board too. Ether is up 2.7% to $2,059. But Solana is down 2.5% to $86.54 and Dogecoin is the worst performer among majors, down 7.4% on the week. Capital is rotating into Bitcoin and Ether. A flight to quality within crypto itself. Every major stock market is crashing today. Over $1.5 TRILLION wiped out till now. KOSPI -6.1% Nikkei -4.8% TAIEX -2.83% Hang Seng -3.41% SSE -2.50% Nifty -1.26% ASX -2.4% STI -2.20% NZX -1.3% Expect more volatility as we get closer to Trump’s… pic.twitter.com/izKLGxlEai — Crypto Rover (@cryptorover) March 23, 2026 The next 24 hours have a specific catalyst. Monday evening marks the deadline on Trump’s ultimatum to hit and obliterate Iran’s power plants if the Strait of Hormuz stays closed. Brent crude is already at $113 a barrel. Goldman Sachs is calling the potential disruption the largest-ever supply shock. Traders are watching $68,000 heading into that deadline. Hold support through the ultimatum, and the structural breakout thesis gets validated. Drop below $66,000, and the liquidity drain has finally caught up to crypto. Neither side has clean control right now. But compared to gold and equities, Bitcoin’s path of least resistance looks stubbornly higher. Discover : The best new crypto in the world The post Bitcoin Price Holds $68,500 as Gold Extends Nine-Day Slide and Asian Stocks Drop appeared first on Cryptonews .
23 Mar 2026, 10:59
SUI price drops 5% as bears threaten deeper crash below $0.90
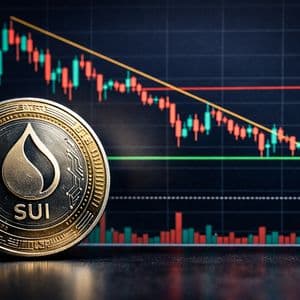
Sui (SUI) price has dropped to under $0.90 as sellers strengthen following a breach of the critical $1.00 level. This comes amid escalating bearish momentum across cryptocurrency markets, and a further crash could plunge the altcoin to lows of $0.70. Sui (SUI) has declined about 5% over the past 24 hours and is down more than 16% over the past week. The token has struggled to gain momentum despite Stripe’s subsidiary, Stablecoin, launching the Sui Dollar ($USDsui) on the Sui blockchain. The price weakness comes in line with a broader market downturn that has weighed on Bitcoin and the wider crypto market in recent months. Market weakness sends Sui below $0.90 As noted, most altcoins have extended recent weakness as prices slip below key support levels, a trend reflected in Sui (SUI). The token has come under pressure alongside Bitcoin, which retreated toward $68,000 on Monday, triggering signs of capitulation among buyers. Broader market dynamics have compounded the downturn in 2026. Comments from Jerome Powell, pointing to persistent inflation, have reinforced a risk-off environment. At the same time, concerns over energy market disruptions linked to the Iran conflict have added to bearish sentiment. The uncertainty, combined with weak technical momentum, has led to long liquidations outpacing shorts, while funding rates have turned sharply negative. In the absence of fresh catalysts, SUI risks extending its decline toward multi-month lows. What's next for bulls? SUI reached an all-time high of $5.35 in January 2025 but has trended steadily lower since then. The token is currently down about 83% from that peak, reflecting sustained bearish pressure. From a technical perspective, SUI has slipped below its 20-day exponential moving average after facing rejection at the 50-day EMA. These indicators now act as key resistance levels around $0.95 and $1.03. Momentum indicators also point to continued weakness. The relative strength index (RSI) stands near 40, suggesting the token is approaching oversold territory, while the moving average convergence divergence (MACD) signals ongoing selling pressure. SUI price chart by TradingView For bullish investors looking at a potential rebound in Sui (SUI), the near-term path depends on reclaiming the $0.90 level and testing resistance around $0.93–$0.95. A sustained move above this former consolidation zone could provide short-term relief. If the token manages to hold and flip this area into support, analysts see scope for a move toward $1.10–$1.27, which aligns with the upper boundary of the range near the 100-day EMA. In more optimistic scenarios, further recovery toward $1.56–$2.33 could follow. However, the near-term outlook remains cautious. The Money Flow Index points to continued downward pressure, and broader market conditions remain a key factor. Stability in Bitcoin, along with improvements in on-chain metrics such as active addresses and whale activity, would likely be needed to support a stronger recovery. On the downside, a deeper correction could see SUI fall toward $0.70, with additional support zones at $0.57 and $0.45. If selling pressure intensifies further, the token could approach its all-time low of $0.36, recorded in October 2023. The post SUI price drops 5% as bears threaten deeper crash below $0.90 appeared first on Invezz
23 Mar 2026, 10:50
GRT Technical Analysis March 23, 2026: Market Structure

GRT market structure is bearish with LH/LL pattern in downtrend; BOS below $0.0226 accelerates the trend. For bullish reversal, impulse close above $0.0245 required.


