


News
23 Mar 2026, 07:03
Solana fails $90 again: will $85 be the next level to crack?

Solana is trading under pressure at the start of the week, struggling to regain momentum after failing to hold above key resistance levels. The token is currently trading at $86.55, down 1.91% in the last 24 hours and nearly 7% over the past week. Source: CoinMarketCap Weak technical signals, declining derivatives activity, and rising geopolitical tensions are combining to keep sentiment cautious, limiting the scope for a near-term recovery in SOL. Price holds below resistance Solana’s recent attempt to push above $92 failed to sustain, triggering a fresh wave of selling. The price slipped below the $90 and $88 levels, accelerating losses as it dropped under $87.20 and formed a low near $85.10. SOL is now consolidating below the 23.6% Fibonacci retracement level of the move from $90.81 to $85.10. It is also trading beneath the 100-hour simple moving average, reflecting continued short-term weakness. On the upside, resistance is building near $88, reinforced by a bearish trend line on the hourly chart. The next barrier stands at $88.60, followed by the key $90 zone. A decisive move above $90 could shift momentum and open the path toward $95 and $102. Downside pressure builds If Solana fails to reclaim the $88 resistance, further downside remains likely. Initial support sits at $85, with stronger levels at $82 and $80. A break below $82 could push the price toward $80, while a close under that level may expose $74 in the near term. This would reinforce the broader downward structure that has emerged over recent sessions. Momentum indicators support this cautious stance. The hourly MACD is strengthening in bearish territory, while the RSI remains below 50, indicating weak buying pressure and limited upside momentum. Geopolitical tensions hit crypto sentiment Crypto markets are starting the week on a softer note as tensions in the Middle East intensify. Concerns around a potential escalation involving the US and Iran have weighed on risk appetite. On Monday, US President Donald Trump posted on Truth Social , “PEACE THROUGH STRENGTH, TO PUT IT MILDLY!!!” The statement followed Iran’s warning that it could target energy and water infrastructure in Gulf nations if threats to strike its electricity grid are carried out. This backdrop has pressured digital assets, with Bitcoin closing below $67,360 on Sunday and triggering broader liquidations. Solana followed the trend, slipping below $87 and continuing to trade cautiously. Weak derivatives activity signals caution Market participation in Solana derivatives has been declining, reinforcing the bearish tone. Futures Open Interest on Binance fell to $871.40 million on Monday and has been trending lower since mid-January, signalling reduced trader engagement. Funding rates have also turned negative at -0.0011%, indicating that short positions are paying longs and reflecting bearish positioning in the market. Despite this, institutional demand has remained resilient. Data showed $21.10 million in inflows into Solana products last week, marking six consecutive weeks of positive flows. However, any reversal in these inflows could add further downside pressure. On the daily chart, the RSI stands near 46, suggesting neutral momentum, while the MACD has slipped below the signal line and is approaching zero. This indicates fading bullish strength after the price failed to break above the descending trendline near $91.44. The post Solana fails $90 again: will $85 be the next level to crack? appeared first on Invezz
23 Mar 2026, 07:01
CAKE Technical Analysis 23 March 2026: Market Structure

CAKE is showing LH/LL structure in the downtrend, BOS above $1.3994 is a bullish reversal signal. Breakdown below $1.3432 opens bearish target $0.8684, BTC correlation increases downside risk.
23 Mar 2026, 07:00
Bitcoin Hits Two-Week Low as War Tensions Fan Uncertainty
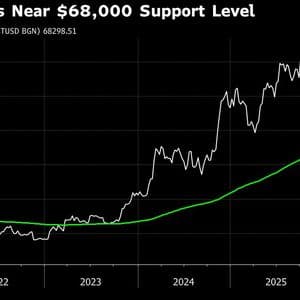
Bitcoin fluctuated near a two-week low on Monday, sliding in early Asia trading before rebounding to a key support level amid escalating tensions in the Middle East.
23 Mar 2026, 07:00
Shiba Inu Price Prediction: A Realistic Forecast for 2026 Through 2030

BitcoinWorld Shiba Inu Price Prediction: A Realistic Forecast for 2026 Through 2030 As the cryptocurrency market continues to mature, investors and analysts globally are scrutinizing the long-term trajectory of major assets like Shiba Inu (SHIB). This analysis provides a detailed, evidence-based forecast for SHIB’s potential price movements from 2026 through 2030, examining the critical factors that could influence its journey toward the $0.000330 threshold. We will explore market data, ecosystem developments, and broader economic conditions to build a comprehensive outlook. Shiba Inu Price Prediction: Understanding the Current Landscape Any credible forecast must begin with a clear understanding of the present. As of late 2025, Shiba Inu operates within a complex digital asset ecosystem. Originally launched as an experiment in decentralized community building, SHIB has since expanded its utility far beyond its meme coin origins. The development of the Shibarium layer-2 scaling solution marks a pivotal shift, aiming to reduce transaction costs and increase throughput for decentralized applications (dApps) within its network. Furthermore, the project’s dedicated team has consistently executed its roadmap, introducing token-burning mechanisms and new use cases. These factors collectively influence SHIB’s market valuation. Consequently, analysts must weigh technological progress against market sentiment and macroeconomic pressures. Historical volatility provides crucial context, but future performance hinges on adoption and real-world integration. Key Drivers for SHIB’s Price from 2026 to 2030 Several interconnected variables will dictate SHIB’s price path over the next five years. First, the success and adoption of the Shibarium network stand as a primary catalyst. Increased usage can drive transaction fee burns, potentially reducing the overall token supply. Second, broader cryptocurrency market cycles, often influenced by Bitcoin’s performance and regulatory developments, will create overarching trends. Third, the expansion of the Shiba Inu ecosystem—including projects like ShibaSwap, SHIB: The Metaverse, and related NFTs—can enhance token utility and demand. Finally, macroeconomic factors such as inflation rates, interest rate policies, and institutional investment flows into digital assets will serve as external forces. Analysts from firms like CoinShares and Arcane Research frequently highlight these elements in their quarterly reports. Comparative Analysis and Market Positioning To assess SHIB’s potential, a comparison with other major cryptocurrencies is instructive. While Bitcoin and Ethereum are often viewed as store-of-value and smart-contract platforms, respectively, SHIB occupies a unique niche as a community-driven asset with evolving utility. Its performance often correlates with, but can deviate from, the broader altcoin market. For instance, during periods of high risk appetite, community tokens may see amplified gains. Conversely, they may face steeper corrections during market downturns. The following table outlines a simplified, scenario-based framework for SHIB’s potential price ranges. These are not guarantees but projections based on the interplay of the drivers mentioned above. Year Conservative Scenario Base Case Scenario Optimistic Scenario Key Condition 2026 $0.000012 – $0.000018 $0.000019 – $0.000028 $0.000029 – $0.000040 Shibarium adoption rate 2027 $0.000020 – $0.000030 $0.000031 – $0.000050 $0.000051 – $0.000080 Ecosystem dApp growth 2028 $0.000035 – $0.000060 $0.000061 – $0.000110 $0.000111 – $0.000180 Macroeconomic stabilization 2029 $0.000070 – $0.000130 $0.000131 – $0.000220 $0.000221 – $0.000300 Mainstream utility integration 2030 $0.000120 – $0.000200 $0.000201 – $0.000280 $0.000281 – $0.000380 Regulatory clarity & institutional entry Reaching the $0.000330 level would require alignment with the optimistic scenario’s upper bounds by 2030. This trajectory assumes exceptional execution across all key drivers, including mass adoption of Shibarium, a sustained bullish macro cycle for crypto, and significant supply reduction through burns. It remains a highly ambitious target, underscoring the importance of continuous monitoring of on-chain metrics and development milestones. The Path to $0.000330: A Feasibility Assessment The question of SHIB reaching $0.000330 by 2030 is fundamentally a question of market capitalization and tokenomics. Achieving that price point would imply a market valuation in the hundreds of billions of dollars, placing it among the top global financial assets. Such growth would necessitate not just incremental improvement, but transformative adoption. Potential pathways include: Sustained Token Burns: A significant and verifiable reduction in circulating supply. Breakout Ecosystem Application: A dApp on Shibarium achieving viral, global usage. Favorable Regulatory Environment: Clear regulations that foster innovation and institutional investment. Shift in Market Perception: A rebranding from a ‘meme coin’ to a recognized utility platform. Historical precedents in cryptocurrency show that such parabolic growth, while rare, is not impossible. However, investors should approach this target with rigorous due diligence. Market analysts, including those cited in Bloomberg Crypto and The Block research, consistently advise diversification and risk management, especially for assets with high volatility profiles like SHIB. Conclusion This Shiba Inu price prediction for 2026 through 2030 presents a structured, scenario-based analysis grounded in current ecosystem developments and market mechanics. The journey to $0.000330 is an ambitious one, contingent upon a confluence of aggressive supply reduction, massive ecosystem adoption, and a supportive macro environment. While the optimistic scenario outlines a potential path, the base and conservative cases offer more grounded expectations for long-term investors. Ultimately, SHIB’s future will be written by its community’s execution, its technology’s resilience, and the evolving narrative of digital assets in the global economy. FAQs Q1: What is the most important factor for SHIB’s price growth by 2030? The most critical factor is the successful adoption and utility of the Shibarium layer-2 network. Its ability to host popular, low-cost dApps and facilitate token burns will directly impact supply, demand, and overall valuation. Q2: How do token burns affect the SHIB price prediction? Token burns permanently remove tokens from circulation. A consistent, high-volume burn mechanism can reduce supply over time. If demand remains steady or increases, this reduction can create upward pressure on price, a key component of long-term forecasts. Q3: Is the $0.000330 target for SHIB realistic? While mathematically possible under an extreme optimistic scenario, it is a highly ambitious target requiring unprecedented growth in adoption, utility, and market capitalization. Investors should treat it as a speculative upper bound rather than a probable outcome. Q4: How does Bitcoin’s performance influence SHIB’s forecast? Bitcoin often sets the overall trend for the cryptocurrency market. A sustained bullish period for Bitcoin typically lifts altcoins like SHIB, providing a favorable tide. Conversely, a Bitcoin bear market usually presents a significant headwind for all digital assets. Q5: What are the biggest risks to this Shiba Inu price prediction? Key risks include regulatory crackdowns targeting meme-inspired assets, failure of the Shibarium network to gain traction, intensified competition from other layer-2 solutions, and prolonged adverse macroeconomic conditions that reduce risk appetite across all markets. This post Shiba Inu Price Prediction: A Realistic Forecast for 2026 Through 2030 first appeared on BitcoinWorld .
23 Mar 2026, 06:55
Hyperliquid Traders Shift Dramatically to Commodities, Leaving XRP and SOL Behind
BitcoinWorld Hyperliquid Traders Shift Dramatically to Commodities, Leaving XRP and SOL Behind In a significant market shift, traders on the decentralized exchange Hyperliquid are now directing more capital toward traditional commodities than toward major cryptocurrencies like XRP and SOL. This trend, identified in recent market data, highlights a broader movement of capital within decentralized finance (DeFi) platforms. Consequently, this activity provides a real-time gauge of institutional and sophisticated retail sentiment. The data, reported by CoinDesk, shows a clear preference for oil futures contracts during a period of heightened global uncertainty. This analysis explores the volumes, drivers, and potential implications of this notable pivot on the Hyperliquid platform. Hyperliquid Traders Drive Record Commodities Volume Over the past 24 hours, perpetual futures contracts for West Texas Intermediate (WTI) and Brent crude oil on Hyperliquid recorded a combined trading volume exceeding $500 million. This substantial figure starkly contrasts with the volumes for popular cryptocurrency perpetuals. Specifically, SOL perpetual futures saw approximately $176 million in volume. Meanwhile, XRP perpetuals registered a significantly lower $31 million. This disparity in trading activity is not merely a daily anomaly. Instead, it reflects a sustained pattern observed by market analysts over recent weeks. The Hyperliquid platform, known for its high-performance order book and deep liquidity in crypto assets, is now witnessing a surge in traditional asset derivatives. This evolution marks a key development for the DEX landscape. Quantifying the Trading Divergence The volume data reveals the scale of the shift. To illustrate the contrast clearly, the following comparison highlights the 24-hour trading activity: WTI Crude Oil Perpetuals: ~$300 million Brent Crude Oil Perpetuals: ~$200 million SOL (Solana) Perpetuals: $176 million XRP Perpetuals: $31 million This data indicates that oil contracts, as a combined category, attracted nearly triple the volume of SOL and over sixteen times the volume of XRP. Furthermore, other commodities like silver also showed increased activity, though volumes remained below the flagship oil products. This trend suggests a calculated reallocation of capital by active traders on the platform. Geopolitical Instability Fuels Commodities Resurgence The primary driver behind this trading behavior is a renewed focus on macroeconomic and geopolitical factors. Analysts point directly to heightened volatility in global commodities markets. This volatility stems from ongoing geopolitical instability, particularly related to conflict in the Middle East. Iran’s involvement has created supply concerns and price fluctuations in the oil market. Traders, therefore, are seeking exposure to these volatile price movements. Perpetual futures contracts on platforms like Hyperliquid offer a direct, leveraged, and crypto-native way to gain this exposure. Consequently, capital is flowing from potentially saturated or stagnant crypto markets into these traditionally volatile assets. Market experts note that commodities often act as a hedge during periods of inflation and geopolitical tension. The ability to trade these assets on a decentralized exchange adds a layer of accessibility and efficiency. Traders can enter and exit positions without relying on traditional, custodial brokers. This fusion of traditional asset classes with DeFi infrastructure is a defining feature of the current market cycle. The trend underscores a maturation of the DEX user base, which is increasingly applying sophisticated macro strategies. The Broader Context of Crypto Market Sentiment This shift occurs against a backdrop of cautious sentiment in the cryptocurrency market. While Bitcoin and Ethereum have seen periods of consolidation, altcoins like XRP and SOL have faced specific headwinds. Regulatory developments and network-specific news can impact trader focus. The relatively lower volumes for XRP and SOL on Hyperliquid may reflect a temporary rotation rather than a fundamental rejection. However, the sheer magnitude of the capital moving into commodities signals a strong, immediate preference. It demonstrates that DeFi traders are highly responsive to global events and will pivot their strategies to capture emerging opportunities, regardless of the asset class. Implications for Decentralized Exchange Development The surge in commodities trading carries significant implications for the future of decentralized exchanges. Firstly, it validates the demand for a broader range of financial instruments within DeFi. Exchanges that can successfully list and provide liquidity for real-world assets (RWAs) may gain a competitive edge. Secondly, it attracts a different profile of trader—one attuned to global macroeconomics. This could increase overall platform sophistication and liquidity depth. Finally, it bridges the gap between traditional finance (TradFi) and decentralized finance, potentially driving greater institutional adoption of DEX platforms as versatile trading venues. From a technical perspective, supporting commodities futures requires robust price oracles and reliable settlement mechanisms. Hyperliquid’s ability to handle this volume suggests its infrastructure is scaling effectively. This performance could set a precedent for other DEXs to expand their offerings beyond purely crypto-native assets. The trend is a clear indicator that the future of trading is hybrid, blending the best of on-chain efficiency with exposure to the full spectrum of global markets. Conclusion The analysis of Hyperliquid trading data reveals a dramatic and instructive pivot: traders are favoring commodities like oil over cryptocurrencies such as XRP and SOL. This shift, driven by geopolitical volatility and the search for actionable price movements, highlights the evolving sophistication of the DeFi trading community. The $500 million+ volume in oil futures underscores the scale of this movement and points to a future where DEXs serve as universal platforms for all asset classes. For market observers, the activity on Hyperliquid provides a valuable, real-time signal of where smart capital is flowing in an uncertain world. FAQs Q1: What is Hyperliquid? Hyperliquid is a high-performance decentralized exchange (DEX) known for its order book model and support for perpetual futures contracts across various assets, including cryptocurrencies and commodities. Q2: Why are traders buying oil futures on a DEX? Traders use DEXs like Hyperliquid for direct access, self-custody, and often higher leverage. Oil futures provide exposure to price volatility driven by current geopolitical events, offering clear trading opportunities. Q3: Does this mean XRP and SOL are losing popularity? Not necessarily. The data shows a short-term capital rotation based on specific market conditions. Traders may be temporarily allocating funds to volatile commodities but could rotate back into cryptocurrencies later. Q4: What are perpetual futures contracts? Perpetual futures are derivative contracts without an expiry date, allowing traders to speculate on an asset’s price indefinitely. They are popular in crypto and are now being applied to commodities on platforms like Hyperliquid. Q5: How does this trend affect the average cryptocurrency investor? It signals that market participants are closely watching macro events. This can influence overall market liquidity and sentiment. It also shows the growing integration of traditional finance and DeFi, which may lead to more diverse investment products. This post Hyperliquid Traders Shift Dramatically to Commodities, Leaving XRP and SOL Behind first appeared on BitcoinWorld .
23 Mar 2026, 06:45
EUR/USD Volatility: Critical Signals Questioned After Devastating Energy Shock – Commerzbank Analysis
BitcoinWorld EUR/USD Volatility: Critical Signals Questioned After Devastating Energy Shock – Commerzbank Analysis FRANKFURT, March 2025 – The EUR/USD currency pair faces renewed scrutiny as traditional volatility indicators show conflicting signals following significant disruptions in European energy markets, according to technical analysis from Commerzbank. Market participants now question whether established technical patterns can accurately predict movements amid fundamental energy supply shocks that have reshaped currency correlations and trading dynamics across global forex markets. EUR/USD Volatility Patterns Under Microscope Technical analysts at Commerzbank have identified unusual behavior in EUR/USD volatility measurements following the recent energy market disruptions. Typically, currency pairs exhibit predictable volatility patterns during market stress, but current readings show significant deviations from historical norms. The bank’s research team notes that Bollinger Band width, Average True Range (ATR), and implied volatility metrics all present conflicting signals about future price movements. Furthermore, traditional support and resistance levels have failed to hold during recent trading sessions. This breakdown suggests that fundamental factors, particularly energy price movements, now override technical considerations. Market participants report increased uncertainty when interpreting standard chart patterns, as energy-driven flows create unusual price action that contradicts conventional technical analysis. Energy Market Disruptions Reshape Currency Dynamics The European energy crisis of late 2024 and early 2025 has fundamentally altered the relationship between the euro and energy commodities. Previously, EUR/USD movements correlated primarily with interest rate differentials and economic growth expectations. However, the recent supply shocks have created new dynamics where energy prices directly influence currency valuations through multiple channels. Commerzbank’s Technical Perspective Commerzbank’s currency strategists emphasize that technical analysis must now incorporate energy market variables. Their research indicates that traditional chart patterns require adjustment when energy volatility exceeds certain thresholds. The bank has developed modified technical indicators that account for energy price volatility, though these remain experimental and require further validation through market testing. The analysis reveals several key findings. First, moving averages that previously provided reliable support and resistance now break more frequently during energy market stress. Second, momentum indicators like the Relative Strength Index (RSI) show different overbought and oversold thresholds during energy-driven moves. Third, volume patterns during energy-related price movements differ significantly from typical currency trading activity. Historical Context and Market Evolution Energy markets have influenced currency valuations for decades, but the magnitude and mechanism of recent impacts represent a significant shift. Previous energy shocks, such as the 1970s oil crises or the 2008 commodity boom, affected currencies primarily through inflation channels and trade balance effects. The current situation differs because energy prices now directly impact manufacturing costs, consumer spending, and central bank policy in real-time. European natural gas prices have shown particular correlation with EUR/USD movements since 2022. However, the relationship strengthened dramatically during the 2024-2025 winter season when supply constraints coincided with increased industrial demand. This created a feedback loop where energy prices influenced the euro, which then affected energy import costs, creating additional currency pressure. Technical Indicator Performance Analysis Commerzbank’s research team conducted extensive backtesting of technical indicators during energy market stress periods. Their findings reveal significant performance degradation for many popular tools. For instance, Fibonacci retracement levels showed only 42% accuracy during high-energy-volatility periods compared to 68% accuracy during normal conditions. The table below summarizes key technical indicator performance during energy market disruptions: Technical Indicator Normal Conditions Accuracy Energy Stress Accuracy Performance Change Moving Average Crossovers 61% 47% -14% RSI Overbought/Oversold 58% 39% -19% Bollinger Band Breakouts 55% 44% -11% Support/Resistance Levels 67% 51% -16% These results suggest that traders relying solely on traditional technical analysis face increased risk during energy market disruptions. The data indicates that fundamental factors now play a larger role in price determination, requiring adjusted analytical approaches. Market Structure Changes and Liquidity Impacts Energy market volatility has also affected forex market structure and liquidity patterns. During periods of extreme energy price movements, EUR/USD liquidity typically decreases as market makers widen spreads and reduce position sizes. This reduced liquidity then amplifies price movements when large orders execute, creating volatility spikes that technical indicators often fail to predict. Several structural changes have emerged. First, trading volumes have shifted toward energy-sensitive trading sessions. Second, algorithmic trading systems have adjusted their parameters to account for energy market correlations. Third, risk management practices now incorporate energy volatility metrics alongside traditional currency risk measures. Market participants report several practical challenges. Position sizing becomes more difficult when energy volatility affects currency correlations. Stop-loss orders trigger more frequently during energy-driven price spikes. Traditional risk-reward calculations require adjustment to account for changing volatility patterns. Institutional Adaptation Strategies Major financial institutions have developed various adaptation strategies. Some have created hybrid models combining technical and fundamental analysis. Others have developed specialized indicators that incorporate energy market data. Many have increased their focus on cross-asset correlations and developed more sophisticated risk management frameworks. Commerzbank recommends several approaches for navigating current market conditions. First, traders should monitor energy markets alongside currency technicals. Second, position sizes should account for increased correlation risk. Third, technical analysis should incorporate volatility-adjusted parameters during energy market stress. Regulatory and Policy Implications Central banks and financial regulators have noted the changing relationship between energy markets and currency stability. The European Central Bank has acknowledged that energy price volatility complicates monetary policy decisions and currency management. Regulatory bodies monitor these developments for potential systemic risk implications. Policy responses have evolved gradually. Some central banks have adjusted their intervention frameworks to account for energy-driven currency movements. Regulatory reporting requirements now include additional information about energy market exposures. International coordination has increased regarding energy-currency linkages and their financial stability implications. The changing dynamics present both challenges and opportunities. While traditional technical analysis faces limitations, new analytical approaches emerge. Market participants who adapt successfully may gain competitive advantages. However, the transition period creates uncertainty and requires careful risk management. Conclusion The EUR/USD currency pair demonstrates how energy market disruptions can challenge established technical analysis frameworks. Commerzbank’s research highlights the limitations of traditional volatility signals during fundamental supply shocks. Market participants must now incorporate energy market analysis into their currency trading strategies, adjusting technical approaches to account for changing correlations and volatility patterns. While technical analysis remains valuable, its application requires greater nuance and integration with fundamental factors, particularly during periods of energy market stress that reshape currency dynamics and challenge conventional trading wisdom. FAQs Q1: How has the energy shock specifically affected EUR/USD technical analysis? Energy market disruptions have reduced the reliability of traditional technical indicators for EUR/USD. Tools like moving averages, RSI, and Bollinger Bands show significantly lower accuracy during energy volatility spikes because fundamental factors now override typical chart patterns. Q2: What time frame does Commerzbank’s analysis cover? The analysis primarily examines the period from 2022 through early 2025, with particular focus on the 2024-2025 winter season when energy market disruptions most significantly impacted currency correlations and technical indicator performance. Q3: Are all technical indicators equally affected by energy market volatility? No, different indicators show varying degrees of performance degradation. Momentum indicators like RSI experience the largest accuracy declines (-19%), while trend-following tools like moving averages show more moderate effects (-14%), according to Commerzbank’s research. Q4: How should traders adjust their strategies given these findings? Traders should incorporate energy market monitoring alongside technical analysis, adjust position sizes for increased correlation risk, use volatility-adjusted parameters during energy stress, and consider hybrid models combining technical and fundamental approaches. Q5: Is this change in technical indicator performance permanent? While energy-currency correlations may evolve, the fundamental relationship appears structural rather than temporary. Market participants should expect continued interaction between energy markets and currency technicals, though the specific dynamics may change as markets adapt and new energy sources develop. This post EUR/USD Volatility: Critical Signals Questioned After Devastating Energy Shock – Commerzbank Analysis first appeared on BitcoinWorld .


