


News
4 Jun 2026, 22:30
Bitcoin’s Great Wealth Transfer May Fuel Next Rally, Says CryptoQuant CEO

CryptoQuant CEO Ki Young Ju says Bitcoin’s current distribution phase may be less a sign of structural weakness than a major transfer of supply from old market participants to US financial institutions, ETFs and new long-term holders. In a series of posts on X, Ki argued that selling by Bitcoin OGs and long-time miners is part of a broad “change of hands” rather than evidence that the asset has exhausted its cycle. The key question, in his view, is not only how much supply is being sold, but who is ultimately absorbing it. “I believe that the selling by Bitcoin OGs and long-time miners is part of a major shift in hands, transferring to US traditional financial institutions, investors, and ETFs,” Ki wrote. “So, I disagree with the claim that Bitcoin won’t do well anymore once the shift is complete and there’s no more liquidity coming in.” Bitcoin’s Ownership Base Is Changing Ki’s thesis centers on the composition of Bitcoin holders. He said that, for any asset, the long-term market setup depends heavily on the capital base behind it. If the new owners are institutions capable of attracting larger pools of liquidity over time, he argued, the transition could ultimately support another upward cycle. “For any asset, what ultimately matters is who holds it,” he wrote. “If the people holding it now are entities that can bring in even greater liquidity going forward, then I think we can look forward to the next rally at any time.” The argument marks a notable framing of the current market. Bitcoin has seen intense sell pressure even as large institutional buyers have continued absorbing supply. Ki described the current distribution phase as “a massive change of hands,” pointing to a market where old holders are distributing while ETFs, Strategy and newer cohorts take the other side. Related Reading: Bitcoin Traders Turn Most Fearful In 2 Months Following Crash According to Ki, Bitcoin investors’ average cost basis is around $53,000. Historically, he said, bear markets ended only after price fell below the realized price. He previously thought that level would be difficult to revisit because of institutional inflows and Strategy’s limited selling. But he said recent price action indicates “unusually strong sell pressure.” The scale of absorption is central to his concern. Since January 2023, Strategy has bought 711,206 BTC and sold only 32 BTC, removing a net 711,174 BTC from circulation, according to Ki. Since March 2024, when Bitcoin was also around $63,000, ETFs have absorbed 509,102 BTC while Strategy bought another 650,706 BTC. Together, that amounts to 1,240,808 BTC absorbed, yet price has returned to the same level. For context, Ki noted that exchange reserves sit around 2.7 million BTC, while Satoshi Nakamoto is estimated to hold around 1 million BTC. In other words, more Bitcoin than Satoshi’s estimated stack, and nearly half of exchange reserves, has been absorbed without producing a sustained price advance. Short-Term Buyers Are Maturing Ki also pointed to a major shift inside the realized-cap structure. Bitcoin is at roughly the same price as two years ago, he said, but the holder base looks materially different. The 6-month-to-2-year cohort, representing investors who entered during this cycle, now accounts for 53% of realized cap, up from 15% two years ago. That matters because, in Ki’s interpretation, short-term holders are gradually becoming long-term holders. He compared the current figure with the previous cycle, when Bitcoin bottomed after the same cohort reached 68% of realized cap. “Short-term holders are evolving into long-term holders,” he wrote. Related Reading: Bitcoin Drops Below $66,000 Amid Mounting ETF Outflows, $4B Withdrawn In 12 Days The setup is not without risk. Ki reposted a separate observation from Julio Moreno stating that overall Bitcoin demand, including speculative and spot demand, is contracting at a monthly pace of 232,000 BTC. Moreno argued that the current correction is tied directly to Bitcoin demand conditions, not to equities, oil or macro indicators, noting that stocks are at all-time highs while manufacturing activity is improving. Ki’s posts therefore present a split picture. On one side, current demand is contracting and sell pressure remains heavy despite historic institutional absorption. On the other, Bitcoin’s ownership base is migrating toward institutions and maturing newer cohorts that may provide a deeper demand base in the future. Ki acknowledged that this transition comes with a cultural cost. “Honestly, in terms of rising asset value, I think traditional financial institution investors might provide an even stronger demand base than Bitcoin OGs,” he wrote. “Of course, in that process, some of the cypherpunk values may get diluted. I really regret that part too.” For markets, the debate now turns on whether Wall Street’s growing share of Bitcoin ownership can offset the supply leaving older holders and miners. Ki’s conclusion remains constructive, but conditional on that transfer becoming a source of future liquidity rather than a ceiling on upside. “Still, I believe there will definitely be another upward cycle for Bitcoin,” he wrote. “As an investor, I still believe in Bitcoin and think it’s worth waiting a bit longer.” At press time, BTC traded at $62,696. Featured image created with DALL.E, chart from TradingView.com
4 Jun 2026, 22:20
Tom Lee Predicts $250,000 Ethereum Price Target, Driven by AI and Tokenization

BitcoinWorld Tom Lee Predicts $250,000 Ethereum Price Target, Driven by AI and Tokenization Tom Lee, chairman of Bitmine (BMNR) and co-founder of Fundstrat Global Advisors, has set a long-term price target of $250,000 for Ethereum (ETH). Speaking at the Proof of Talk conference in Paris on June 3, Lee argued that the prevailing market pessimism surrounding Ethereum is itself a strong buy signal, predicting a transformative shift in the network’s utility. Lee’s Vision: A Machine-to-Machine Economy on Ethereum Lee’s thesis centers on the emergence of a ‘machine-to-machine’ economy, where autonomous AI agents will require a native digital currency to transact for computing power and other resources. He posits that Ethereum, with its robust smart contract infrastructure, is best positioned to serve as the base currency for this new economic layer. This prediction moves beyond traditional DeFi and NFT narratives, framing ETH as the fuel for an AI-driven computational marketplace. Following this, Lee envisions the development of a comprehensive real-world asset (RWA) tokenization platform built on Ethereum. He argues that the combination of Ethereum-based stablecoins and the massive growth of tokenized assets—from real estate to commodities—could elevate the network’s total value into the trillions of dollars, thereby justifying his ambitious price target. Market Dynamics and Institutional Shifts Lee highlighted significant structural changes within the Ethereum ecosystem. He noted that the Ethereum Foundation has intentionally sold down its holdings to approximately 0.1% of the total ETH supply, a move that has allowed corporate validators to fill the void. This shift, in his view, indicates a maturation of the network’s security and governance model, moving from a foundation-led structure to a more decentralized, institution-backed one. A key part of this narrative involves Bitmine’s own position. Lee confirmed that Bitmine currently holds approximately 5.4 million ETH, nearing its publicly stated goal of acquiring 5% of the total circulating supply. This accumulation by a single corporate entity, while a bullish signal for price, also raises questions about centralization risks that the broader market is likely to debate. Why This Matters for Investors Lee’s prediction, while extremely bullish, should be viewed within the context of his long-term investment horizon. The $250,000 target is not a short-term forecast but a multi-year vision based on adoption curves for AI and tokenization that are still in their infancy. For readers, this highlights the potential for massive value creation but also underscores the volatility and regulatory uncertainty that could delay or derail such a trajectory. The key takeaway is not the specific price number, but the underlying thesis: Ethereum’s value may increasingly be derived from its role in AI and real-world asset markets, rather than just cryptocurrency speculation. Conclusion Tom Lee’s $250,000 price target for Ethereum is a bold, long-term projection grounded in the convergence of AI, machine-to-machine economies, and asset tokenization. While the path to such valuations is fraught with challenges, including regulatory hurdles and competition from other blockchains, the thesis provides a compelling framework for understanding Ethereum’s potential evolution from a speculative asset to a foundational layer of the digital economy. Investors are advised to weigh the optimistic vision against the current market realities and their own risk tolerance. FAQs Q1: Is $250,000 a realistic price target for Ethereum? Tom Lee’s target is a long-term, multi-year projection based on the successful adoption of AI-driven economies and widespread tokenization of real-world assets. While it is an extremely bullish forecast, it is not a short-term prediction and depends on several technological and regulatory milestones being met. Q2: What is the ‘machine-to-machine’ economy that Lee refers to? This concept describes a future where autonomous AI agents and devices transact with each other for services like computing power, data storage, or API access. Lee believes Ethereum’s smart contracts could serve as the primary settlement layer for these transactions, with ETH as the native currency. Q3: How does Bitmine’s large ETH holding affect the market? Bitmine’s accumulation of approximately 5.4 million ETH (nearing 5% of the total supply) is a significant bullish signal from a major institutional player. However, it also introduces a degree of centralization risk, as the market’s health could become more dependent on the actions of a single large holder. This post Tom Lee Predicts $250,000 Ethereum Price Target, Driven by AI and Tokenization first appeared on BitcoinWorld .
4 Jun 2026, 22:15
MEXC Leads on Slippage for ETH and Silver Futures, TokenInsight Report Shows
BitcoinWorld MEXC Leads on Slippage for ETH and Silver Futures, TokenInsight Report Shows A recent analysis of liquidity in the global futures market has revealed notable differences in how major cryptocurrency exchanges perform across various asset classes. The report, published by TokenInsight, found that while Binance, Bitget, and OKX dominate in overall market depth, MEXC offers the most favorable slippage for trading Ethereum (ETH) and silver (XAG) futures. Liquidity and Slippage: What the Data Shows The report measured market depth as the total volume of buy and sell orders within ±0.1% of the current market price—a standard metric for assessing how easily large orders can be filled without moving the price. Binance, Bitget, and OKX led in this category across multiple trading pairs, reflecting their status as the most liquid venues for futures trading. However, when it came to slippage—the difference between the expected price of a trade and the price at which it is actually executed—MEXC outperformed its larger competitors for two specific assets. For ETH futures, MEXC recorded a slippage rate of 0.015%, while for silver futures (XAG), the rate was even lower at 0.01196%. These figures suggest that traders executing medium-to-large orders in these markets may achieve better pricing on MEXC than on more widely used platforms. Bitget and Binance Lead for BTC and Gold The report also highlighted that for Bitcoin (BTC) futures, Bitget offered the lowest slippage at 0.008%, making it the most cost-effective exchange for large BTC trades in terms of price impact. Meanwhile, Binance led for gold (XAU) futures, reinforcing its strong position in precious metals derivatives alongside its dominance in crypto markets. These findings underscore that no single exchange uniformly outperforms across all asset classes. Instead, traders may benefit from selecting platforms based on the specific instrument they intend to trade. Why Slippage Matters for Traders Slippage is a critical factor for active traders and institutional investors. Even small differences in slippage can significantly affect profitability, especially for high-frequency strategies or large block trades. The TokenInsight report provides a data-driven basis for traders to optimize their execution strategies by routing orders to the exchange offering the best liquidity conditions for a given asset. Conclusion The TokenInsight analysis adds valuable transparency to the futures trading landscape, revealing that market concentration varies significantly by segment. While Binance, Bitget, and OKX dominate overall depth, MEXC offers a competitive edge for ETH and silver futures. Traders should consider these nuances when choosing where to execute orders, as the optimal platform depends on the specific asset and trade size. FAQs Q1: What is slippage in futures trading? Slippage is the difference between the expected price of a trade and the actual price at which it is executed. It occurs when market orders are filled at a less favorable price due to insufficient liquidity or rapid price movements. Q2: Why did MEXC perform better for ETH and silver futures? The TokenInsight report indicates that MEXC had tighter bid-ask spreads and higher order book density for these specific assets within the ±0.1% depth range, resulting in lower slippage compared to other exchanges. Q3: Should traders always use the exchange with the lowest slippage? Not necessarily. Slippage is one factor among many. Traders should also consider fees, security, regulatory compliance, available trading pairs, and overall liquidity before choosing an exchange. This post MEXC Leads on Slippage for ETH and Silver Futures, TokenInsight Report Shows first appeared on BitcoinWorld .
4 Jun 2026, 22:10
SpaceX Confirms $135 Per Share IPO Price, Sources Say
BitcoinWorld SpaceX Confirms $135 Per Share IPO Price, Sources Say SpaceX has communicated to investment banks that its highly anticipated initial public offering (IPO) will be priced at $135 per share, according to sources familiar with the matter. The company has indicated that this valuation is firm and not subject to change, marking a significant milestone for the private space exploration leader. Valuation and Market Context At $135 per share, the implied valuation for SpaceX would place it among the most valuable publicly traded aerospace companies. While the exact number of shares to be offered has not been disclosed, analysts estimate the company’s total market capitalization could exceed $150 billion, solidifying its position as a dominant force in the commercial space industry. This valuation reflects investor confidence in SpaceX’s core businesses, including its Starlink satellite internet constellation, the reusable Falcon 9 rocket, and the ambitious Starship development program. Implications for Investors and the Space Sector The fixed pricing strategy suggests strong institutional demand and a desire for price stability upon listing. For retail investors, this offers a rare opportunity to gain direct exposure to a company that has largely been accessible only through private funding rounds. The IPO is expected to provide a benchmark for other space-focused companies, potentially accelerating a new wave of public offerings in the sector. However, the company’s high valuation also comes with expectations of sustained revenue growth and profitability, particularly from Starlink, which is still scaling its subscriber base. What This Means for the Broader Market SpaceX’s public debut is likely to be one of the most watched events on Wall Street this year. It represents a major test of investor appetite for high-growth, capital-intensive ventures tied to emerging technologies. The success of the IPO could also influence regulatory discussions around commercial space activities and satellite deployment. For now, the $135 price point signals that SpaceX and its underwriters are aiming for a stable, well-received launch rather than a volatile first-day pop. Conclusion With a confirmed IPO price of $135 per share, SpaceX is moving closer to becoming a publicly traded company. The move is expected to generate significant interest from both institutional and retail investors, while also providing a clearer picture of the market’s valuation of the private space industry. As the company prepares for its listing, all eyes will be on its ability to meet the high expectations set by its ambitious growth plans. FAQs Q1: When will the SpaceX IPO officially launch? The exact date has not been announced, but the IPO is expected to occur within the next few months pending regulatory approvals and market conditions. Q2: How can retail investors buy SpaceX stock? Once the IPO is live, shares can be purchased through most major brokerage platforms. Investors should monitor their brokerage for availability and pricing on the day of the listing. Q3: What are the main risks associated with investing in SpaceX? Key risks include the high capital expenditure required for Starship development, potential delays in Starlink’s profitability, and the cyclical nature of the launch services market. This post SpaceX Confirms $135 Per Share IPO Price, Sources Say first appeared on BitcoinWorld .
4 Jun 2026, 22:05
Ethereum daily transaction volume surges to two-month high of $9.9 billion
BitcoinWorld Ethereum daily transaction volume surges to two-month high of $9.9 billion Ethereum’s daily on-chain transaction volume reached a two-month high of $9.92 billion on June 2, signaling a significant uptick in network activity. The surge follows a robust first quarter that saw over 200.4 million transactions processed across the Ethereum network. What is driving the increase in on-chain activity? The rise in transaction volume is primarily attributed to two key factors: increased Layer 2 settlement activity and higher stablecoin flows. Layer 2 solutions, such as Arbitrum and Optimism, have been processing a growing number of transactions before settling them on the Ethereum mainnet, contributing to the overall volume. Additionally, stablecoin transfers—particularly USDC and USDT—have seen a notable increase, often used for trading, lending, and cross-border payments within decentralized finance (DeFi) protocols. Broader implications for the Ethereum ecosystem This surge in on-chain activity suggests sustained demand for Ethereum’s network, even as competing blockchains like Solana and BNB Chain continue to attract users. The increased volume also supports the network’s fee revenue, which is critical for validators and the overall security of the network. However, higher activity can lead to increased gas fees, which may impact smaller transactions. What this means for investors and users For investors, rising transaction volume is often viewed as a bullish signal, indicating network usage and potential value accrual to ETH. For regular users, the development highlights the importance of Layer 2 solutions to maintain affordable transaction costs. The trend also underscores the growing integration of stablecoins into the Ethereum economy, which now processes billions of dollars in transfers daily. Conclusion Ethereum’s $9.9 billion daily transaction volume reflects a healthy and expanding on-chain ecosystem, driven by Layer 2 scaling and stablecoin demand. While the network faces challenges around scalability and fees, the current activity points to sustained user engagement and real-world utility. FAQs Q1: What is the significance of Ethereum’s daily transaction volume hitting $9.9 billion? It indicates strong network usage and demand, often associated with increased DeFi activity, trading, and stablecoin transfers. It also signals that the network remains a leading platform for decentralized applications. Q2: How does Layer 2 activity affect Ethereum’s mainnet transaction volume? Layer 2 solutions bundle many transactions off-chain and periodically submit them as a single batch to the Ethereum mainnet. This increases the mainnet’s transaction volume and settlement activity without overloading the base layer. Q3: Could higher transaction volumes lead to increased gas fees? Yes, if the network becomes congested, gas fees can rise. However, Layer 2 solutions help mitigate this by offloading a significant portion of transactions, keeping fees lower for users who operate on those layers. This post Ethereum daily transaction volume surges to two-month high of $9.9 billion first appeared on BitcoinWorld .
4 Jun 2026, 21:57
SpaceX IPO draws record Wall Street fanfare, but valuation math gives analysts pause
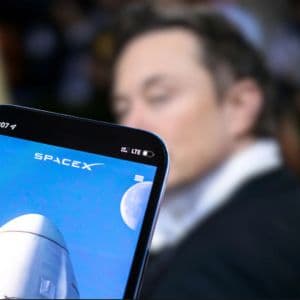
SpaceX is set to launch the largest IPO in U.S. history as early as June 12 at a valuation near $1.75 trillion. With more than 555 million Class A shares set to be listed at $135 each, with the aim of raising roughly $75 billion, there’s not a shortage of opinions on whether investors should jump on the Musk-led train. How can SpaceX be worth $1.75 trillion when it is losing billions? SpaceX will list 555 million of its class A shares on the Nasdaq under the ticker SPCX. It will be the largest initial public offering in U.S. history, with shares expected to begin trading as early as June 12 at a price of $135 each. The company has a target valuation of nearly $1.75 trillion and is aiming to raise roughly $75 billion. Bank of America, Morgan Stanley, and JPMorgan are all hosting exclusive events this week to pitch SpaceX to their wealthiest clients. Bank of America plans to light its Manhattan headquarters spire to resemble a rocket launch. More than 5,000 clients across BofA’s private bank and Merrill Lynch have been invited to launch parties, with events streamed to offices nationwide. Despite the excitement and hype, a look at the company’s finances reveals that Starlink and reusable rockets like the Falcon 9, the combined company, which now includes the social media platform X and the AI firm xAI, are losing a tremendous amount of money. In the first quarter of 2026, SpaceX posted an operating loss of $1.9 billion. The decline is largely driven by xAI, which lost $2.5 billion in that same quarter alone. While Starlink is profitable, bringing in $4.4 billion in operating income, its efforts are being offset by the massive costs of building AI technology. Meanwhile, SpaceX generated $19.3 billion in revenue over the last four quarters. At the IPO price, SpaceX would trade at roughly 103 times its sales over the last four quarters, which is about 40% more expensive than Palantir, currently the priciest stock in the S&P 500. Morningstar analyst Nicolas Owens estimates that the company is actually worth about half that amount, closer to $780 billion. He also thinks that investors will get a better chance to buy the stock later at a lower price. A Motley Fool review of more than 100 popular technology stocks found only eight that ever traded above 100 times sales. All of them dropped sharply afterward, with an average peak-to-trough decline of 75%. The 10 largest U.S. IPOs by initial market value have underperformed the S&P 500 by an average of 127 percentage points since listing. Why is Wall Street not worried about SpaceX? Despite its numbers, SpaceX’s Falcon 9 became the first commercially reusable orbital rocket in 2018. The company’s S-1 filing with the SEC also says its next-generation Starship could reduce the cost of reaching orbit by 99%. SpaceX values its total addressable market at $28.5 trillion, spanning satellite internet, launch services, and long-term ambitions like orbital data centers. ARK Invest, which holds SpaceX in its venture ETF, has argued that Starlink alone could support a $2 trillion valuation at IPO. JPMorgan strategists led by Nikolaos Panigirtzoglou pushed back on fears that mega-IPOs will drain liquidity from existing stocks. What is the true value of SpaceX? Elon Musk’s firms often do business together, an interaction that goes beyond exchanging cash for products and services. Even investors apply the goodwill of one firm to another. Tesla disclosed a $2 billion investment in xAI in January after the SpaceX-xAI merger, and Cryptopolitan previously reported that SpaceX’s prospectus shows the company plans to spend $697 million on Tesla Megapack batteries for xAI data centers and $131 million on Tesla Cybertrucks. SpaceX’s revenue grew 15% year over year. Its merger with xAI valued the firm at $1 trillion and xAI at $250 billion. The company generated $818 million in revenue. Anthropic recently closed a $65 billion funding round at a $965 billion valuation and reported run-rate revenue of $47 billion. The company said it expects to post its first quarterly operating profit of $559 million on $10.9 billion in Q2 revenue. On a price-to-sales basis, Anthropic trades at about 20 times run-rate revenue, a fraction of what xAI commands inside SpaceX’s structure. The smartest crypto minds already read our newsletter. Want in? Join them .


