


News
23 Mar 2026, 14:44
Ripple Price Analysis: XRP Recoveries Stay Weak Below This Key Level
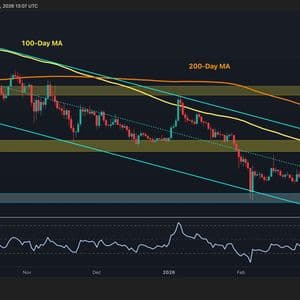
XRP has been in a sustained downtrend since its July 2025 peak, losing ground against both the dollar and Bitcoin over the past eight months. With the price still trapped below key moving averages and inside a descending channel, the broader structure remains bearish heading into the final stretch of Q1 2026. Ripple Price Analysis: The USDT Pair XRP is trading around $1.42 after bouncing from the February low near $1.20, a level that has held as key horizontal support. The recovery, however, remains shallow. The price is still well beneath the 100-day and 200-day MAs sitting near $1.80 and $2.10, which represent the next major resistance levels to watch. A sustained close above $1.80 would be the first sign of bullish momentum returning, while a breakdown below $1.20 exposes XRP to a retest of the $1.00 psychological level and even drop much deeper. The RSI has also recovered from deeply oversold territory but is hovering around the midpoint, offering no clear directional conviction just yet. The BTC Pair XRP/BTC is hovering near 2,020 sats, deep within a months-long descending channel and below both the 100-day (2,100 sats) and 200-day (~2,200 sats) moving averages. The resistance band at 2,500 sats has capped every recovery attempt since October 2025. The 2,000 sats support zone has held on a closing basis, and the RSI is recovering from its most oversold level of the correction cycle, which is a modest positive sign. But unless XRP breaks above the channel’s upper trendline and reclaims the 100-day and 200-day moving averages, the path of least resistance remains to the downside. The post Ripple Price Analysis: XRP Recoveries Stay Weak Below This Key Level appeared first on CryptoPotato .
23 Mar 2026, 14:35
Monero Price Prediction: XMR Trapped Below $180 as Exchange Liquidity Dries Up

Monero (XMR) slammed into a brick wall at $380 this week, fueling a bearish Monero price prediction as momentum drains from the privacy coin sector. The rejection was violent and precise. Price action is now curling downward, trapped beneath the 200-day Exponential Moving Average (EMA) with bears firmly in control of the tape. Monero Price Prediction: Can XMR Hold $150 or Is a Crash to $135 Coming? XMR is sitting at $355.95 on the 2h chart, and the structure here is messy but there is something worth noting underneath the noise. Price got absolutely obliterated in early February, dropping from above $400 all the way to $287 in a near-vertical flush, and what has happened since then is a slow and choppy recovery that has been grinding higher lows over the past 6 weeks without ever fully breaking down again. Source: XMRUSD / TradingView The $400 level marked on the chart as a red dotted line is the psychological and technical ceiling that has not been reclaimed since the initial dump, and every rally attempt since February has failed to get back there, including the most recent push to $383 which rolled over and pulled back to the $340 range before bouncing again. The current price action shows XMR bouncing off the $340 area for the second time in a week, which is starting to define that zone as a short term support floor, and the move back toward $356 suggests buyers are showing up there consistently. The immediate resistance to clear is the $360 to $370 range where price has been churning, and above that the $383 recent high is the last wall before $400 comes back into view. The bearish case is straightforward, lower highs since the February peak combined with a choppy recovery structure suggests this is distribution rather than accumulation, and a break below $340 would open the door back toward the $305 to $310 lows. The $400 level is the line in the sand. Until that gets reclaimed, this chart is still in recovery mode, not breakout mode. Discover : The best new crypto in the world The post Monero Price Prediction: XMR Trapped Below $180 as Exchange Liquidity Dries Up appeared first on Cryptonews .
23 Mar 2026, 14:35
Crypto market just added $100 billion in market cap

The cryptocurrency market staged a strong rebound over the past 24 hours, led by Bitcoin ( BTC ), which has since reclaimed the $71,000 level after sessions of consolidation. As of press time, the market cap stood at $2.44 trillion, an increase of about $100 billion from the $2.34 trillion recorded 24 hours ago. Crypto market 30-day chart. Source: CoinMarketCap Leading the gains, Bitcoin climbed about 4.05% to trade near $71,545, reclaiming key psychological levels above $70,000 after briefly dipping below $68,000 in prior sessions. Ethereum ( ETH ) followed with a 4.97% advance to around $2,181, while XRP rose 3.53% to $1.45. BNB also posted gains of roughly 2.70%, trading near $647. Top crypto market gainers. Source: Finbold Why crypto market is rallying A key catalyst behind the rally came from easing geopolitical tensions after reports indicated that President Donald Trump delayed potential military escalation involving Iran. The development reduced immediate market uncertainty, pushing oil prices lower and improving risk appetite across global markets, including cryptocurrencies. At the same time, market structure played a significant role in accelerating gains. Following recent declines, bearish positioning had built up across derivatives markets, with negative funding rates signaling heavy short exposure. As prices began to rise, a wave of short liquidations triggered a squeeze, amplifying upward momentum. Bitcoin’s clean breakout above the $70,000 and $71,000 resistance zone further reinforced bullish sentiment and opened the path toward higher levels. At the same time, corporate accumulation also remains in play, with Strategy (NASDAQ: MSTR ) announcing on Monday that it added over 1,000 BTC to its holdings, signaling continued confidence in Bitcoin as a long-term asset. Broader macro and regulatory dynamics are also contributing to the improved outlook. Optimism around potential U.S. regulatory clarity, alongside stabilizing equity markets and a softer dollar environment, has supported a rotation back into risk assets, with Bitcoin increasingly acting as a “digital gold” proxy. Bitcoin’s next price target Despite the positive momentum, key technical levels remain in focus. In this line, Bitcoin is now holding above the critical $70,000 support zone, with immediate resistance seen between $72,000 and $74,000. A sustained breakout above this range could open the door to a move toward $75,000 or higher, while a reversal below $70,000 may signal a retest of the $68,000–$69,000 range. The post Crypto market just added $100 billion in market cap appeared first on Finbold .
23 Mar 2026, 14:35
Trump Iran Nuclear Agreement: A Stunning Diplomatic Shift in Middle East Policy

BitcoinWorld Trump Iran Nuclear Agreement: A Stunning Diplomatic Shift in Middle East Policy In a significant development for global security, U.S. President Donald Trump stated that Iran has agreed not to develop nuclear weapons. This announcement, made from the White House on Tuesday, marks a potential turning point in one of the world’s most tense diplomatic standoffs. The declaration immediately reverberated across international capitals, prompting analysis from policymakers and experts worldwide. Consequently, this statement requires careful examination within the complex historical and political context of U.S.-Iran relations and nuclear non-proliferation efforts. Analyzing the Trump Iran Nuclear Agreement Statement President Trump’s assertion about Iran’s agreement originates from recent diplomatic communications. The White House provided a brief readout following the President’s remarks. Officials clarified the context of this new understanding. Importantly, this development follows years of escalating tensions and the U.S. withdrawal from the Joint Comprehensive Plan of Action (JCPOA) in 2018. The administration now cites a fresh commitment from Tehran. This pledge reportedly involves a verifiable halt to weapons-grade nuclear development activities. Furthermore, international monitoring agencies may receive enhanced access. The statement’s timing is crucial, occurring amidst broader regional negotiations. Historical context is essential for understanding this announcement. The relationship between the United States and Iran has been fraught for decades. Key events include the 1979 Iranian Revolution and the subsequent hostage crisis. Additionally, Iran’s nuclear program became a major international concern in the early 2000s. The 2015 JCPOA, negotiated by the Obama administration, aimed to curb Iran’s nuclear capabilities. However, President Trump criticized that deal heavily. He ultimately withdrew the United States from the agreement. This move reinstated severe economic sanctions on Iran. Consequently, Tehran gradually resumed previously restricted nuclear activities. The new statement suggests a possible de-escalation path. The Geopolitical Impact of a Nuclear Restraint Agreement This potential agreement carries profound implications for Middle Eastern stability. Regional powers are closely monitoring the situation. Key stakeholders include Israel, Saudi Arabia, and the United Arab Emirates. These nations have historically viewed Iran’s nuclear ambitions as an existential threat. A verifiable restraint agreement could reduce immediate conflict risks. However, it also reshapes regional security dynamics. For instance, it may affect ongoing proxy conflicts in Yemen and Syria. Moreover, it influences global energy markets and strategic alliances. International reactions have been mixed but attentive. European Union diplomats expressed cautious optimism. They emphasized the need for concrete, verifiable actions. Simultaneously, Russian and Chinese officials acknowledged the development. They highlighted the importance of multilateral diplomacy. The United Nations Secretary-General welcomed any step toward non-proliferation. Crucially, the International Atomic Energy Agency (IAEA) will play a central verification role. Its inspectors provide the technical backbone for any agreement. Their access and reporting will determine the statement’s factual weight. Expert Analysis on Verification and Implementation Nuclear policy experts stress that declarations require rigorous verification. Dr. Elena Michaels, a senior fellow at the Center for Nonproliferation Studies, provided context. “A political statement is the first step,” Michaels noted. “The real work lies in technical negotiations. These talks define monitoring protocols and inspection regimes.” She outlined essential components for a credible agreement. These components include: Unrestricted IAEA Access: Inspectors must visit declared and suspected sites. Continuous Monitoring: Installing cameras and sensors at key facilities is non-negotiable. Data Transparency: Iran must provide a complete history of its nuclear activities. Sanctions Relief Timeline: Economic incentives must be clearly linked to compliance milestones. Furthermore, the domestic political landscape in both countries affects implementation. In the United States, Congress may seek to legislate on any new deal. In Iran, hardline factions could oppose concessions. Therefore, the path from statement to sustained agreement is complex. It involves continuous diplomatic engagement and confidence-building measures. Comparative Timeline: From JCPOA to the Present Understanding this announcement requires a view of the recent timeline. The following table outlines key events in U.S.-Iran nuclear diplomacy. Date Event Significance July 2015 JCPOA signed by Iran, P5+1, and EU. Established limits on Iran’s nuclear program in exchange for sanctions relief. May 2018 U.S. withdraws from JCPOA. Trump administration reimposes sanctions, beginning ‘maximum pressure’ campaign. May 2019 Iran begins reducing JCPOA compliance. Tehran announces incremental steps away from the deal’s limits. January 2020 U.S. drone strike kills General Soleimani. Tensions spike dramatically; Iran responds with missile strikes. 2021-2024 Indirect talks in Vienna. Multiple rounds of negotiations occur but fail to restore the JCPOA. Present Statement Trump announces Iran’s agreement. Represents a new, potentially bilateral understanding outside the JCPOA framework. This timeline shows a cycle of escalation and diplomacy. The new statement attempts to break that cycle. It proposes a different foundation for engagement. Whether it succeeds depends on the details not yet public. The international community awaits those specifics. Conclusion President Trump’s announcement that Iran has agreed not to develop nuclear weapons is a significant diplomatic event. It opens a potential new chapter in a long-standing confrontation. However, its ultimate importance hinges on verification and implementation. The global non-proliferation regime depends on such agreements being both politically viable and technically sound. Moving forward, all parties must prioritize transparency and sustained dialogue. The alternative is a return to dangerous escalation. Therefore, this moment requires careful, sober statecraft from all involved nations. The stakes for regional and global security could not be higher. FAQs Q1: What exactly did President Trump announce regarding Iran? President Trump stated that Iran has agreed not to develop nuclear weapons. This announcement suggests a new bilateral understanding, though the specific terms and verification mechanisms require further clarification from both governments. Q2: How does this new statement relate to the old Iran nuclear deal (JCPOA)? This appears to be a separate, potentially bilateral understanding distinct from the multilateral 2015 JCPOA. The U.S. withdrew from the JCPOA in 2018. This new announcement may represent an effort to establish a different framework for restraining Iran’s nuclear program. Q3: Who will verify if Iran is complying with this agreement? Verification would likely involve the International Atomic Energy Agency (IAEA), the UN’s nuclear watchdog. Credible compliance depends on robust, unimpeded inspections of Iranian nuclear facilities, a point emphasized by non-proliferation experts. Q4: What has been the international reaction to this development? Reactions have been cautious. Allies and rivals are awaiting concrete details. Many governments have expressed a hope for de-escalation but stress that any agreement must be verifiable and durable to improve regional security. Q5: What are the main challenges to making this agreement lasting and effective? Key challenges include establishing a technically sound inspection regime, managing domestic political opposition in both the U.S. and Iran, defining clear consequences for non-compliance, and addressing the concerns of regional allies like Israel and Saudi Arabia. This post Trump Iran Nuclear Agreement: A Stunning Diplomatic Shift in Middle East Policy first appeared on BitcoinWorld .
23 Mar 2026, 14:27
TRON Price Eyes $0.32 as TRX Treasury Grows & Tether Mints 1B USDT

Tron Inc. adds 159,009 TRX at $0.3135 avg, pushing corporate holdings over 688M tokens. Tether prints $1B on Tron, hitting $85 billion supply. Data shows TRON outpaced Ethereum in total USDT supply. Tron price gained some momentum due to renewed institutional interest and the treasury expansion by Tron Inc. The Florida-based blockchain firm announced the acquisition of an additional 159,009 TRX tokens at an average price of $0.3135, and now the corporate treasury totals over 688 million TRX. Tether Minted Another 1B USDT on TRON But the Bigger Story Is What It Represents At first glance, it looks like just another routine update. These minting events happen often enough that most people scroll past them without thinking twice. With this latest issuance, the total… https://t.co/eES83GFVKX pic.twitter.com/4CnRLrOyS6 — Emmy (@ThisEmmy_1) March 23, 2026 The blockchain also announced a massive $1 billion USDT minting event by Tether to approximately $85 billion. The stablecoin minting positioned the network as a leading infrastructure globally for stablecoin circulation. Tron’s Global Acceptance While high-frequency minting events are often viewed as routine, market analysts suggest this $1 billion injection represents a deeper shift in how values move within the digital asset ecosystem. Data also shows TRON outpaced Ethereum in total USDT supply, largely due to its high-throughput capabilities and low-friction fee structure. It has also become a practical use case for blockchain tech at scale in the case of large-scale institutional transfers and retail users in emerging markets. The minting reflects rising global demands for fast, low-fee settlements, whereas Tron’s treasury growth signals a long-term institutional “buy-and-hold” conviction in the network’s plan for growth. Tron Inc. (NASDAQ: TRON) acquired 159,509 TRX tokens today at an average price of $0.3135, further increasing its TRX treasury holdings to more than 688.0 million TRX in total. The company aims to further grow its Tron DAT holdings to enhance long term shareholder value. For live… — Tron Inc. (@TRON_INC) March 23, 2026 According to Tron Inc., the NASDAQ-listed firm’s tweet, ” The company aims to further grow its Tron DAT holdings to enhance long-term shareholder value.” With the latest acquisition, the company’s “Tron DAT (Digital Asset Tresury) strategy now represents one of the largest public-company holdings of TRX globally . TRX Price Analysis: $0.32 Resistance Hard to Break? On the 15-minute chart, TRX has claimed the mid-range of the consolidation and is trading at $0.3081, staging a high-conviction recovery run. After hitting a high near #0.3194, TRX saw a “V-shaped” retracement during the early hours of the Monday session and found a solid floor at the $0.3056 level. Tron/USD (15-minute Chart) The green descending resistance line on the 15-minute chart is the immediate hurdle. A sustained close above $0.3120 has the potential to trigger a retest of the $0.3200 level. It is also important to note that Tron Inc. provided the token a “corporate floor” at the $0.3135 mark and thinned the sell-side liquidity. The Usage Wars Unlike trad-fi systems that do not offer clarity on money supply shifts, the TRX network offers full on-chain transparency with its public wallet address . The combination of $85 billion in USDT and corporate accumulation highlights a growing shift between Tron and other L1 networks. In comparison, Ethereum remains the hub for complex De-Fi, and Tron has secured its place as the global settlement layer for stablecoins. U.S investors also have the transparency of the NASDAQ-listed Tron Inc. due to the SEC’s requirement of regular filing of company holdings. The SEC ensures an added layer of accountability often missing in the crypto sector. As the company continues its 360-day daily purchase program, the fundamental pressure on the TRX price continues to lean bullish. Also Read: Aptos (APT) Price Surges above $1 with Regulatory Clarity
23 Mar 2026, 14:27
Strategy Buys 1,031 BTC, Holdings Hit 762K Amid Market Volatility
Strategy announces purchase of 1,031 BTC for $76.6 million at 74,326 per coin. Total holdings have now reached 762,099 BTC. Company to continue aggressive Bitcoin buying despite market volatility. MicroStrategy, now known as Strategy, announced today, March 23, 2026 on social media platform X that it has acquired 1,031 BTC for approximately $76.6 million at an average price of $74,326 per coin. This purchase has been funded through proceeds from its at-the-market (ATM) offering. This purchase has pushed the company’s total holdings to 762,099 BTC, which have been acquired at an aggregate cost of $57.69 billion with an average price of $75,694 per BTC. Strategy has acquired 1,031 BTC for ~$76.6 million at ~$74,326 per bitcoin. As of 3/22/2026, we hodl 762,099 $BTC acquired for ~$57.69 billion at ~$75,694 per bitcoin. $MSTR $STRC https://t.co/goog7l1eaV — Strategy (@Strategy) March 23, 2026 The update came via a US Securities and Exchange Commission (SEC) Form 8-k filing. This highlights Strategy’s aggressive treasury strategy even as Bitcoin’s spot price fluctuated between $68,000 and $70,000 today. The timing of this buy is particularly interesting because the Bitcoin price had dropped to around $68,000 in the early hours of the day moving to $70,000 due to market fluctuations caused by macroeconomic factors. The strategy to invest in Bitcoin at a price point of $74,326, which is higher than the day’s low but lower than its recent peaks, is an indication of dollar-cost averaging, which is an important part of the company’s Bitcoin accumulation strategy outlined by Executive Chairman Saylor. Investors see this as a vote of confidence in the face of volatility and can calm the markets for $MSTR and its preferred stock. ATM Proceeds Fuel BTC War Chest Expansion The SEC filing provides granular details on Strategy’s capital-raising efforts. During the week of March 16-22, 2026, the company sold 509,111 shares of Class A common stock ($MSTR) under its ATM program, generating $76.5 million in notional value and net proceeds of the same amount after commissions. No sales occurred for its preferred stock series, STRF (10.00% Series A Perpetual Strife), STRC (Variable Rate Series A Perpetual Stretch), STRK (8.00% Series A Perpetual Strike), or STRD (10.00% Series A Perpetual Stride), leaving substantial issuance capacity, which is $1,619.3 million for STRF, $1,975.8 million for STRC, $20.3316 million for STRK and $4,014.8 million for STRD. These funds were swiftly deployed into Bitcoin, underscoring Strategy’s “Bitcoin-first” financial policy. As of March 22, the firm’s BTC treasury stood at an impressive 762,099 coins, representing a market value exceeding $53 billion at today’s $70,000 price, yielding an unrealized gain of roughly $4.4 billion on paper. This positions Strategy as one of the largest corporate Bitcoin holders globally, rivalling nations and institutions in its conviction play. Implications for Investors and the Broader Crypto Market For shareholders, this update reinforces Strategy’s dual role as a software firm and de facto Bitcoin ETF proxy. Trading under Nasdaq symbols like $MSTR, the stock usually amplifies BTC’s price action, offering leveraged exposure without direct custody risks. Preferred shares, with their fixed dividends, appeal to income-focused investors betting on Strategy’s BTC yield generation. With global liquidity tightening and ETF approvals expanding, institutional adoption accelerates. Strategy’s average cost basis of $75,694 remains competitive. Critics, however, flag dilution risks from ATM sales, 509,000 shares issued this week alone, and balance sheet leverage, with BTC compromising over 99% of assets. Yet, Saylor’s vision remains bold, which is to convert fiat into “digital gold” before hyperbitcoinization. As Bitcoin tests $70,000, Strategy’s hodl stance, now 762,000 strong, could catalyze the next leg up. Investors eyeing upcoming unlocks, Fed decisions and halving echoes for catalysts. With $6.2 billion remaining ATM capacity for $MSTR, more buys loom. Also Read: The MicroStrategy BTC Origin Story, Journey From Software to Bitcoin


