


News
4 Jun 2026, 09:20
Gold Holds Modest Gains as Fed Rate Hike Bets Clash with Iran Risk Premium

BitcoinWorld Gold Holds Modest Gains as Fed Rate Hike Bets Clash with Iran Risk Premium Gold prices managed to hold on to modest recovery gains during Tuesday’s trading session, though the rally lacked conviction as traders weighed conflicting signals from hawkish Federal Reserve expectations and escalating geopolitical tensions in the Middle East. The precious metal remains caught between safe-haven demand driven by the Iran situation and the headwind of a stronger U.S. dollar and rising bond yields. Fed Rate Hike Bets Cap Gold’s Upside The primary drag on gold’s upward momentum continues to be the market’s growing conviction that the Federal Reserve will maintain or even increase interest rates in the coming months. Stronger-than-expected U.S. economic data, particularly in the labor market and services sector, has pushed back expectations for rate cuts, reinforcing the ‘higher for longer’ narrative. Higher interest rates increase the opportunity cost of holding non-yielding assets like gold, and the dollar’s corresponding strength makes bullion more expensive for overseas buyers. Iran Tensions Provide a Floor Providing a counterbalance to the Fed-driven selling pressure is the ongoing geopolitical uncertainty surrounding Iran. Recent developments, including increased military posturing and diplomatic breakdowns, have rekindled fears of a broader regional conflict. Historically, gold has benefited from such risk-off episodes, as investors seek a store of value outside of fiat currencies and volatile equities. This risk premium is currently preventing a deeper correction in gold prices, even as the technical picture weakens. Market Impact and What to Watch For traders, the immediate outlook hinges on which of these two forces—monetary policy or geopolitical risk—will dominate. A diplomatic breakthrough in the Middle East could quickly erode the risk premium, leaving gold exposed to the Fed’s tightening cycle. Conversely, any significant escalation could propel prices above recent resistance levels. Key U.S. economic data releases, including inflation figures and Fed minutes, will be critical in shaping near-term direction. The market is pricing in a delicate balance, and any surprise in either direction could trigger a sharp move. Conclusion Gold’s modest recovery reflects a market in limbo, pulled between the gravitational force of higher interest rates and the safe-haven allure of geopolitical instability. Until a clearer catalyst emerges—either a decisive shift in Fed policy or a resolution to the Iran crisis—the metal is likely to remain range-bound. Investors should watch for any breakdown below key support levels, which could signal that the Fed narrative is regaining full control. FAQs Q1: Why is gold not rallying despite the Iran tensions? The safe-haven demand from geopolitical risks is being offset by a stronger U.S. dollar and rising bond yields, both driven by expectations that the Federal Reserve will keep interest rates high. This dual pressure is limiting gold’s upside. Q2: What would make gold prices move significantly higher? A clear escalation of the Iran conflict that disrupts oil supplies or triggers a broader regional war would likely push gold sharply higher. Alternatively, a sudden dovish pivot from the Fed on interest rates would remove the primary headwind. Q3: Is gold a good investment right now? Gold can serve as a portfolio hedge against geopolitical uncertainty and inflation. However, with the Fed maintaining a hawkish stance, the opportunity cost of holding gold is elevated. Investors should consider their own risk tolerance and time horizon before allocating capital. This post Gold Holds Modest Gains as Fed Rate Hike Bets Clash with Iran Risk Premium first appeared on BitcoinWorld .
4 Jun 2026, 09:15
XRP’s Price Dropped 13% but the Network Never Stopped Growing

4 Jun 2026, 09:15
Upbit to Halt INJ Deposits and Withdrawals for Network Upgrade on June 4
BitcoinWorld Upbit to Halt INJ Deposits and Withdrawals for Network Upgrade on June 4 South Korean cryptocurrency exchange Upbit has announced a temporary suspension of deposits and withdrawals for Injective (INJ) on June 4, 2025, at 11:00 a.m. UTC. The halt is attributed to a scheduled network upgrade on the Injective blockchain. Details of the Suspension According to Upbit’s official notice, the suspension will begin at 11:00 a.m. UTC on June 4. During this period, users will be unable to deposit or withdraw INJ tokens. Trading of INJ on the exchange is expected to continue as normal, though users are advised to monitor the exchange’s announcements for any changes. The exchange has not specified the exact duration of the maintenance window. Such suspensions typically last until the network upgrade is completed and the exchange confirms the stability of the new protocol version. Why This Matters for INJ Traders Network upgrades are routine but critical events for blockchain protocols. They often introduce new features, improve security, or enhance scalability. For Injective, a layer-1 blockchain optimized for decentralized finance (DeFi), upgrades can directly impact transaction speed and cross-chain functionality. For Upbit users holding or trading INJ, the key takeaway is to complete any desired deposits or withdrawals before the cutoff time. Funds already on the exchange will remain accessible for trading, but transfers in or out will be blocked until the upgrade is finalized. Market Context and Historical Precedent INJ is the native token of the Injective protocol, which supports a range of DeFi applications including derivatives trading and cross-chain bridges. The token has seen significant trading volume on Upbit, one of the largest exchanges in South Korea. Historically, network upgrades on major exchanges rarely cause lasting price disruption. However, short-term volatility can occur around the suspension period, particularly if the upgrade introduces notable changes to tokenomics or network functionality. What Users Should Do Complete any pending INJ deposits or withdrawals before 11:00 a.m. UTC on June 4. Monitor Upbit’s official announcements for updates on the resumption of services. Review the Injective network upgrade details to understand potential impacts on token utility. Conclusion The temporary suspension of INJ deposits and withdrawals on Upbit is a standard operational measure tied to a scheduled network upgrade. While it may cause minor inconvenience for users needing to move funds during the maintenance window, the event itself is routine and reflects the ongoing development of the Injective ecosystem. Traders are advised to plan accordingly and stay informed through official channels. FAQs Q1: Will INJ trading be affected during the suspension? No, Upbit has indicated that trading of INJ will continue as normal during the deposit and withdrawal suspension. Only transfers in and out of the exchange will be paused. Q2: How long will the suspension last? Upbit has not provided an exact end time. The suspension will remain in place until the network upgrade is completed and the exchange has verified the stability of the new protocol version. Q3: What is the purpose of the Injective network upgrade? While specific details of this upgrade have not been disclosed by Upbit, Injective network upgrades typically aim to improve transaction efficiency, security, or cross-chain interoperability. Users are encouraged to review the official Injective protocol announcements for full details. This post Upbit to Halt INJ Deposits and Withdrawals for Network Upgrade on June 4 first appeared on BitcoinWorld .
4 Jun 2026, 09:13
I Won't Quit On Strategy

Summary Strategy is my preferred public Bitcoin vehicle: Saylor compounds BTC per share while institutions, companies, and sovereigns move toward Bitcoin collateral. The stock has reset from ~$470 to ~$135, but the thesis has not; I hold a hedged 10% pro forma stake because great assets are owned before they bloom. The risk is Bitcoin failing as non-sovereign collateral, yet adoption is now real: ~1.90M BTC held by 188 entities, including Strategy and the U.S. reserve. Since my last Strategy ( MSTR ) analysis , the stock is up by nearly 10% in price. I bought the majority of my stake at about $125/share recently. This might not be ultra deep value, but it is undervaluation in a hyper-compounding megatrend of institutional adoption, blockchain security, and tech-beta growth reflexivity. I'm bullish on Bitcoin, and I'm an intrinsic value investor. Yes, both can be true at the same time. I sold the initial profit in the rally through April for about +50%, which is quite good for a few months' holding. But I am still retaining the majority of the stake at about 10% of pro forma capital, which includes multi-portfolio positioning, the whole of which is secured by Nasdaq-100 ( QQQM ) put options. I also have 35% in cash to execute deep value buys if (or when) the AI euphoria market resets. Most of my holdings are in reasonably valued equities with growth positioning across industries, protecting the portfolio from downside risk while also exposing it to upside. My portfolio is far from dangerous; it is risk-averse, secure, institutional, and hedged powerfully. Bitcoin reflects my only non-fundamental holding, and I weight it large because I have enough evidence of the long-term demand. I choose to get my exposure through Strategy stock because I consider the Founder & Executive Chairman Michael Saylor to be a great steward in accumulating Bitcoin per share incrementally over the long term. Why I'm Staying Strong and Won't Quit on You Most romances come and go, but a few are lifelong. Bitcoin will very much be this for me. Even in its moments of failure, or seeming betrayal, the thesis is too strong for me to ignore. Real commitment only requires the conviction to know that there is something truly magical here; it is rare. In 2016, Strategy stock was just over $15 per share. At its recent peak, it reached ~$470. The stock is now trading at only about $135 per share. This is still cheap enough to accumulate in my opinion. The stock price is under the 200-week moving average. My only caveat is that you must be willing to tolerate short-term downside before the next massive cyclical upward surge. If you do not hold the patience and the conviction, you will miss out. Strategy recently sold 0.004% of its 843,706 Bitcoin holdings, which changed its "never sell Bitcoin narrative" a tiny bit, but the long-term thesis is very much intact. Accumulate overwhelmingly, and adjust exposure tactically. Let's get clear on what Strategy is; it's a Bitcoin treasury company, and in my opinion, it's the best one in the world. The proceeds of its recent sale are expected to fund preferred-stock distributions. I am not opposed to this, and I will reiterate, I trust Saylor's strategy. The great thing about great management is you don't have to micromanage them as a shareholder or analyst. You can just let them cook. That's the way it should be. In a world that has become more multipolar, there is real reason to believe that Bitcoin may emerge as one of the leading non-sovereign stores of value. In simple terms, gold is the old-world neutral reserve asset, but Bitcoin is the digital-era neutral reserve asset. In other words, Bitcoin is digitizing monetary neutrality. It's attractive at base for that reason, but it has much more bullish qualities related to tech-market correlation, and expansive cyclical swings that can be traded in and out of, unlike gold's more non-volatile compounding nature in multipolar resurgence (and hence lower return for trading and volatility positioning). Also, gold is not cheap at all by any means. I see moderate 10-15% annual returns as the optimistic base case, but would not be surprised to see gold reset significantly even while Bitcoin soon explodes higher. How Do You Time Your Entry Perfectly? You don't wait for a perfect time to enter a trade. If you wait too long, you will miss the major moves. What you want is evidence of strong management, evidence of strong growth, and a good valuation. Once you have identified this, it is often far better to be on the early side rather than the late side. Once the equity starts to rocket up, it becomes far less approachable. You also lose the magic of being able to say, "I got it before it bloomed." Just think about all of the early Bitcoin adopters. Under an aggressive and ideal early-market adoption of Bitcoin, buying 5-10% of reported daily Bitcoin spot volume from the first robust July 2010 trading data could have seen a $100,000 investment accumulate up to approximately 350,000 Bitcoin by March-April 2011. At $66,738 per Bitcoin today, the $100,000 would have turned into up to approximately $23.5 billion in June 2026. Please note, this is my independent calculation, and I have fact-checked it rigorously. If you waited until 2016 to invest the $100,000 in Bitcoin, the total return would be +14,761.38%; you would have turned $100,000 into $14,861,380. That's a big difference, and I hope you can see why it is better to be early than late. Once you have a winner, it's also wise to hold on. Some positions, just like people, you marry. And you don't marry the price or the wedding, you marry the soul of the asset, and the soul of a person. Weddings come and go. A lot of people have married wrong stock positions, and a lot of people have married wrong people. You only need to get it right once. BTCUSD One-Week-Intervals Price Chart Since Inception (Author's Chart) You Are Stronger Than the Risks You Ought to Overcome I will focus on the core risk here because the others related to MSTR's operating structure I have discussed in detail before. Moreover, I do trust Strategy's management to continue to maintain the treasury structure prudently. The primary notion that you must consider, and must come to terms with, is that Bitcoin could never become a durable non-sovereign reserve asset used by institutions, companies, or countries as long-term collateral. If that trajectory fades, Bitcoin remains a convex, tech-correlated liquidity trade. That doesn't completely erode the long-term return thesis, but it diminishes it from fortress cyclical compounder into a tech-correlation vehicle that isn't as legendary as its full potential. In such an instance, Strategy's capital-markets flywheel may become harder to justify, and its premium over Bitcoin may diminish. To be clear though, I think we have enough evidence that the reserve-asset trend is going to continue. I think it is far too fearful, and a major wasted opportunity, to turn away Bitcoin with so much institutional backing right now. Bitcoin has proven itself. The question is, are you brave enough to participate? 188 tracked entities now hold about 1.90M Bitcoin, which is about 9% of supply. Strategy owns 843,706 Bitcoin, Metaplanet ( MTPLF ) ( MPJPY ) owns 40,177 Bitcoin, Block ( XYZ ) owns 9,299 Bitcoin , and Tesla ( TSLA ) owns 11,509 Bitcoin. Even the U.S. now has a Strategic Bitcoin Reserve . Adoption is therefore moving from ETF rails to corporate treasuries and some sovereign balance sheets. Bitcoin is still early, and Bitcoin is for the bold and the fearless. Conclusion: Strong Buy Today's entry may not be perfect, but you don't need perfect timing. You need the grit to endure some turbulence before liftoff. This is not a 1-year, a 3-year, or a 5-year trade. This is an asset worth marrying for a lifetime. Bitcoin is dangerous, but it is in capable hands. Where could it be in a few years? If we simply follow the trend of all-time highs, around $180,000 per Bitcoin is surely reasonable. And remember, if Bitcoin rips 3x, Strategy rips 9x. That's the power of the company that Saylor has pioneered.
4 Jun 2026, 09:12
60M XRP Leaves Whale Hands — Is a Sub-$1 Dip Needed Before a Relief Bounce?

XRP Whales Offload 60 Million Tokens as Bears Target the $0.87–$0.92 Zone XRP is coming under renewed pressure as whale activity and weakening technical signals raise fresh questions about where the market could stabilize next. According to prominent crypto analyst Ali Martinez, data from Santiment shows that roughly 60 million XRP have been sold or redistributed by large holders over the past week. While redistribution does not always indicate outright selling, such movements are closely watched by traders because whale activity often precedes periods of heightened market volatility. Why is this the case? Well, large investors have the ability to influence liquidity and market sentiment, and the latest shift in holdings comes at a time when the broader cryptocurrency market is already experiencing increased selling pressure. As a result, many market participants are questioning whether XRP has reached a local bottom or if further downside remains ahead. XRP Paints a Cautious Picture The broader sentiment across the crypto market has turned more cautious, with XRP now caught in a wider wave of selling pressure. This has fueled debate among investors over whether the asset has already formed a local bottom or still has room to decline further before finding solid support. Market commentator CasiTrades adds to the bearish outlook, suggesting XRP may be entering a key phase of its current correction. Based on Elliott Wave analysis , she points to what appears to be a developing subwave 3 decline, typically one of the sharpest and most aggressive stages in a corrective cycle. She also highlights that XRP has slipped below a major support level that had held for months. Using Fibonacci extension levels, she identifies the $0.92 zone as a critical downside target, closely aligned with the widely watched $0.87 support area that many analysts believe could attract strong buyer interest if tested. In her scenario, XRP could see a swift drop toward $0.92 before staging a temporary relief bounce toward $1.20. However, she notes that caution should not be thrown to the wind because any recovery may face strong resistance, potentially setting up one final retest of lower support near $0.87. Despite the short-term bearish structure, some traders view the pullback as a necessary market reset. Such corrections often help clear excess leverage and speculative positioning, creating conditions for a more sustainable recovery if demand returns at key price levels. Currently, XRP is trading at $1.16 per CoinCodex data, down by 9.18% over the past week. With whale redistribution rising and key support under pressure, XRP sits at a decisive point, where the $0.87–$0.92 zone may ultimately determine whether the next major move is a deeper correction or the foundation for a broader recovery.
4 Jun 2026, 09:08
Why is the Ripple (XRP) Price Down This Week? (June 4)
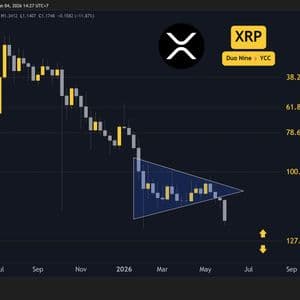
XRP is down 9% on the weekly chart! Can the support at $1 stop the downtrend? Ripple (XRP) Price Predictions: Analysis Key support levels: $1 Key resistance levels: $1.4, $1.6, $2 Downtrend Resumes After three months of XRP moving sideways to form a large pennant, the price finally fell below it. With this latest drop, XRP resumes its downtrend, which is on a collision course with the $1 support level. Unfortunately, buyers have vanished from the order books as crypto assets across the board are in the red this week. XRP is no different and was unable to stop the recent sell pressure. Because of this, lower lows are likely in the future. Source: TradingView Key Support Approaching The most important support level right now is found at $1. This level has not been tested so far this year, and it’s likely to be tested in the near future if this downtrend continues at this pace. For buyers to return, XRP needs to become attractive again. A price around $1 is also a key psychological level that has a good chance of triggering a battle between buyers and sellers. Hopefully, this level will allow for a relief rally once tested. Source: TradingView Bearish Cross on 3-Day MACD Last week, we discussed the bearish cross on the 2-day timeframe. However, since then, the 3-day MACD also did a bearish cross. This reconfirms the downtrend and encourages sellers to take positions expecting new lows. Sellers have been dominating since mid-May when buyers had a last attempt at a breakout. That move turned into a bullish trap, and the price has been going down non-stop since. Source: TradingView The post Why is the Ripple (XRP) Price Down This Week? (June 4) appeared first on CryptoPotato .


