


News
2 Jun 2026, 12:30
Polymarket Faces Backlash After Strategy Bitcoin Sale

The disclosure caused a dispute on Polymarket, where more than $80 million had been wagered on whether the company would sell Bitcoin by May 31. Although the sale occurred before the deadline, it was not publicly revealed until June 1, leading Polymarket to initially propose a “No” resolution. Strategy Bitcoin Sale Triggers Controversy A dispute over the outcome of a Polymarket prediction market intensified after Strategy disclosed that it sold Bitcoin before the market’s deadline, despite the information only becoming public after the cutoff date. More than $80 million has been wagered on the market, which asked whether Strategy would sell Bitcoin by May 31. The controversy began after Strategy revealed in a regulatory filing on June 1 that it sold 32 BTC worth approximately $2.5 million between May 26 and May 31. While the transaction itself occurred within the timeframe specified by the market, the disclosure was not made until after the deadline had passed. As a result, Polymarket initially moved to resolve the market as “No,” arguing that there was no publicly available confirmation of a Bitcoin sale before the deadline expired. (Source: Polymarket) This decision caused debate among market participants. Many users argued that the market should be settled based on whether the sale actually occurred before May 31, rather than when the information became public. Critics of the proposed resolution claimed that the underlying event clearly took place within the required period and that the market should reflect that fact. Several users expressed frustration in the market’s comment section, with some accusing the platform of prioritizing technical interpretations over the actual outcome. Despite these objections, the market continued to indicate overwhelming confidence in a “No” resolution, with approximately 99.9% odds assigned to that outcome. However, the dispute process is still ongoing. Because two proposed resolutions have already been challenged, the final decision will now be made by holders of the UMA token, which powers the decentralized oracle system used by Polymarket to settle prediction markets. According to the platform’s rules, the review process could take up to two days to complete. The situation turned heads because the Bitcoin sale was Strategy’s first since 2022. The company has long been associated with an aggressive Bitcoin accumulation strategy and previously held firm that it did not intend to sell its holdings. Even after the sale, Strategy still holds more than $60 billion worth of Bitcoin, making it one of the largest corporate holders of the asset.
2 Jun 2026, 12:26
Ripple Price Analysis: XRP Shows Deeper Correction Signs Against Both USD and BTC
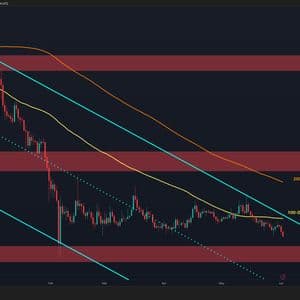
Ripple’s XRP remains under pressure against both the US dollar and Bitcoin, with the price action continuing to respect a broader bearish structure. The daily charts show the token trading below key moving averages while approaching important support zones that could determine the next major directional move. Ripple Price Analysis: The Daily Chart Against the US dollar, XRP is trading near $1.26 after another rejection from the descending channel resistance. The asset remains capped below both the 100-day moving average around $1.4 and the 200-day moving average near $1.65, highlighting the lack of bullish momentum on the higher timeframe. The broader trend continues to favor sellers as XRP remains confined within a well-defined downward channel. Recent attempts to reclaim the 100-day MA failed, leading to another leg lower toward the lower half of the channel. Immediate support is located around the $1.1 to $1.2 demand zone, which has already acted as a significant reaction area earlier in the year. A breakdown below this region could expose the channel’s lower boundary and potentially trigger a deeper correction. XRP/BTC Chart From a relative-strength perspective, the XRP/BTC chart paints a similarly weak picture. The pair remains inside a long-term descending channel while trading beneath both the 100-day and 200-day moving averages. Despite a recent bounce from the local bottom around 1,740 sats, the recovery has so far been limited and remains below the nearest resistance zone around 1,850 sats. However, the pair is currently testing a nearby supply zone around 1,850 sats. A successful breakout above this level could open the door toward the broader resistance region between 1,950 and 2,050 sats, where the 100-day moving average is also located. Failure to reclaim this area would keep the bearish market structure intact and increase the likelihood of another retest of the recent lows. The post Ripple Price Analysis: XRP Shows Deeper Correction Signs Against Both USD and BTC appeared first on CryptoPotato .
2 Jun 2026, 12:23
Strive adds 2,500 bitcoin to hit 19,000 BTC a day after Strategy turns seller

Benchmark's Mark Palmer initiated coverage with a Buy rating and $32 price target as ASST shares fell 3.59% pre-market.
2 Jun 2026, 12:20
Orbs Rolls Out V5 Mainnet Upgrade With Committee Synchronization Feature

BitcoinWorld Orbs Rolls Out V5 Mainnet Upgrade With Committee Synchronization Feature Layer-3 blockchain Orbs (ORBS) has officially announced the rollout of its V5 mainnet upgrade, a technical update aimed at streamlining the network’s core operations. The upgrade introduces a new mechanism called committee synchronization, designed to improve how the blockchain communicates with external EVM-compatible chains. What the V5 Upgrade Introduces The centerpiece of the V5 upgrade is committee synchronization, a system that propagates the official state of the Orbs committee to connected EVM chains. This is achieved through the collected signatures of network guardians, effectively creating a verifiable bridge between the Orbs layer-3 infrastructure and other blockchain ecosystems. The upgrade is focused on making existing processes more efficient rather than adding entirely new functionality. Security Considerations and Risk Profile Orbs has emphasized a unique security characteristic of its network: the chain itself does not hold any total value locked (TVL) or user funds. According to the team, this design choice significantly reduces the attack surface for potential hackers or exploit attempts. While no system is entirely immune to risk, the absence of on-chain funds means that common DeFi attack vectors—such as flash loan exploits or smart contract drainage—are not applicable to the Orbs base layer. Why This Matters for Users and Developers For developers building on Orbs, the V5 upgrade promises more reliable and efficient communication between the layer-3 network and EVM chains like Ethereum. The committee synchronization feature could reduce latency and improve the accuracy of cross-chain data verification. For ORBS token holders, the upgrade reinforces the network’s technical roadmap without introducing new economic or security risks tied to fund custody. Conclusion The Orbs V5 mainnet upgrade represents a measured, technical improvement to an existing layer-3 infrastructure. By focusing on operational efficiency and leveraging its fundless design for inherent security, Orbs continues to differentiate itself in the competitive blockchain middleware space. The upgrade is now live, and the network’s guardians are expected to begin utilizing the new synchronization mechanism immediately. FAQs Q1: What is committee synchronization in the Orbs V5 upgrade? Committee synchronization is a new mechanism that uses guardian signatures to propagate the official state of the Orbs committee to EVM chains, improving cross-chain communication and data verification. Q2: Is the Orbs network safe from hacks after this upgrade? Orbs notes that its chain does not hold any TVL or user funds, which inherently reduces the risk of exploits common in DeFi protocols. However, no blockchain is completely immune to all types of attacks. Q3: When was the Orbs V5 mainnet upgrade released? The upgrade was announced and rolled out in the current news cycle. Specific block heights or activation times were not detailed in the announcement. This post Orbs Rolls Out V5 Mainnet Upgrade With Committee Synchronization Feature first appeared on BitcoinWorld .
2 Jun 2026, 12:15
Wintermute: Crypto Market Lags Stocks as ETF Outflows Hit Record Streak, but Long-Term Outlook Remains Bright
BitcoinWorld Wintermute: Crypto Market Lags Stocks as ETF Outflows Hit Record Streak, but Long-Term Outlook Remains Bright The cryptocurrency market is being left behind in a stock market rally that has seen the S&P 500 climb for nine consecutive weeks, according to a new report from crypto market maker Wintermute. The firm attributes this divergence to a fundamental absence of the strong corporate earnings that are currently driving equities higher. Bitcoin ETFs Experience Record Outflows Wintermute’s report highlights that spot Bitcoin exchange-traded funds (ETFs) are enduring their longest continuous streak of net outflows since their launch earlier this year. This marks a significant shift in sentiment, as these products were previously seen as a primary driver of institutional demand. Additionally, the report notes that Strategy ETFs, which provide leveraged exposure to Bitcoin, have also entered a selling phase, further amplifying bearish pressure. The firm describes this pattern as a typical bear market signal, where the crypto market decouples from traditional equities due to a lack of its own positive catalysts. While the S&P 500 benefits from robust corporate earnings reports, the crypto sector has not seen a comparable fundamental driver to sustain momentum. Market Cycle Resetting: A Silver Lining Despite the current weakness, Wintermute maintains a relatively optimistic long-term outlook. The firm suggests that the market cycle is currently in a reset phase, a process that historically precedes the next major upward move. While relative weakness is expected to persist through the summer months, the report identifies early signs of institutional accumulation. According to Wintermute, long-term investors have begun entering the market via over-the-counter (OTC) desks, using time-weighted average price (TWAP) strategies to build positions gradually. This behavior indicates that sophisticated capital is viewing current price levels as attractive entry points for an 18-month horizon, even if the exact bottom remains uncertain. What This Means for Investors For retail and institutional investors alike, the report suggests that patience may be rewarded. The current environment, characterized by ETF outflows and a lack of immediate catalysts, could represent a buying opportunity for those with a longer time frame. However, Wintermute cautions that predicting the precise market bottom is difficult, and further short-term volatility is likely. The divergence between crypto and equities also underscores a key lesson: the crypto market now operates with its own distinct drivers, separate from traditional macro factors. This independence can be both a risk and an opportunity, depending on the phase of the cycle. Conclusion Wintermute’s analysis presents a nuanced picture of the current crypto market. While short-term headwinds from ETF outflows and a lack of earnings-driven momentum are real, the underlying structural dynamics suggest a market that is resetting for future growth. The entry of long-term investors via OTC desks adds credibility to the view that current prices are attractive from a multi-year perspective. For now, the market appears to be in a waiting game, with the potential for a brighter outlook ahead. FAQs Q1: Why is the crypto market lagging behind stocks right now? A1: Wintermute attributes the divergence to the stock market being driven by strong corporate earnings, a catalyst that is currently absent in the crypto sector. Additionally, Bitcoin ETFs are experiencing record outflows, adding selling pressure. Q2: What are TWAP strategies and why do they matter? A2: Time-weighted average price (TWAP) strategies involve breaking up a large order into smaller chunks over a set period to minimize market impact. Wintermute notes that long-term investors are using this method via OTC desks, signaling confidence in current price levels. Q3: Is this a good time to buy cryptocurrency? A3: Wintermute suggests that current price levels are attractive from an 18-month perspective, though they caution that predicting the exact bottom is difficult. The firm views the current market as being in a reset phase, which historically precedes a new upward cycle. This post Wintermute: Crypto Market Lags Stocks as ETF Outflows Hit Record Streak, but Long-Term Outlook Remains Bright first appeared on BitcoinWorld .
2 Jun 2026, 12:12
Bitcoin derivatives markets flashing warning signs as price plunges below $70,000
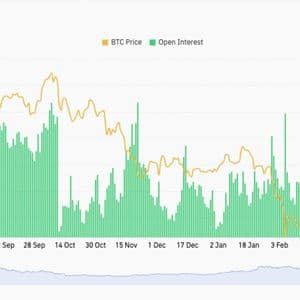
Open interest has risen to 773,000 BTC, one of the highest readings on record, while funding rates remain elevated despite weak spot demand and growing market fear.


