


News
26 May 2026, 10:50
BIT Warns of Sideways Bitcoin Price Action as Spot ETF Outflows Accelerate

BitcoinWorld BIT Warns of Sideways Bitcoin Price Action as Spot ETF Outflows Accelerate Singapore-based crypto financial services platform BIT, formerly known as Matrixport, has issued a market analysis suggesting that Bitcoin is likely to trade sideways in the near term. The assessment follows a notable shift in spot Bitcoin ETF fund flows, which have recently turned from net inflows to net outflows, reversing a key driver of the recent price rally. Institutional Buying Momentum Slows According to BIT’s analysis shared on X, the recent upward movement in Bitcoin’s price was heavily supported by institutional buying activity through spot ETFs and corporate treasury purchases by firms like Strategy (formerly MicroStrategy). However, data now indicates that this trend has reversed. The combined net purchase volume from these institutional channels has dropped to approximately $870 million, a significant decline from the levels seen during the rally. BIT analysts argue that the reduction in institutional demand has removed a critical pillar of support for Bitcoin’s price. Without sustained inflows, the market is now more susceptible to range-bound trading, lacking the momentum needed for a decisive breakout in either direction. Implications for the Broader Market The shift in ETF flows is a closely watched indicator by market participants. Spot Bitcoin ETFs, approved in the U.S. in early 2024, have been a primary channel for traditional investors to gain exposure to the asset class. Large-scale outflows, as observed recently, often signal a cooling of institutional sentiment or profit-taking after a rally. BIT’s forecast suggests that Bitcoin will likely remain within a defined price range until ETF fund inflows stabilize. This outlook aligns with a broader period of consolidation observed across cryptocurrency markets, where volatility has contracted and trading volumes have moderated. What This Means for Investors For retail and institutional investors, the analysis implies a need for patience. The current environment does not present clear directional signals for aggressive long or short positions. Instead, traders may focus on range-bound strategies or wait for confirmation of renewed ETF inflows before expecting a sustained price move. The development also underscores the growing influence of regulated financial products on Bitcoin’s price dynamics. As ETF flows become a more prominent market force, their impact on price discovery and volatility is likely to increase. Conclusion BIT’s analysis provides a data-driven perspective on Bitcoin’s short-term trajectory, attributing the expected sideways movement to a tangible shift in institutional capital flows. While the outlook is neutral, the situation remains fluid. Any stabilization or reversal of ETF outflows could quickly alter the market’s direction. Investors are advised to monitor fund flow data as a leading indicator for Bitcoin’s next significant move. FAQs Q1: What are spot Bitcoin ETFs and why do they matter? Spot Bitcoin ETFs are exchange-traded funds that hold actual Bitcoin, allowing investors to gain exposure to the cryptocurrency through traditional stock exchanges. Their inflows and outflows are seen as a proxy for institutional demand and can significantly influence Bitcoin’s price. Q2: How long could the sideways market last according to BIT? BIT did not provide a specific timeline but indicated that the range-bound trading would persist until ETF fund inflows stabilize. This could last days or weeks depending on market conditions and investor sentiment. Q3: Does this analysis mean Bitcoin’s price will fall? No. BIT’s analysis suggests a sideways or range-bound market, not necessarily a price decline. It indicates a lack of strong directional momentum, meaning Bitcoin could trade within a relatively narrow band without a clear upward or downward breakout. This post BIT Warns of Sideways Bitcoin Price Action as Spot ETF Outflows Accelerate first appeared on BitcoinWorld .
26 May 2026, 10:47
Hut 8: Richly Valued And Still Highly Dependent On Bitcoin Mining

Summary Hut 8 Corp (HUT) is transitioning from bitcoin mining to AI data center hosting, but remains reliant on bitcoin for near-term cash flow. I rate HUT as Hold due to its premium valuation—trading at 36x sales versus peers—and execution risks tied to delayed AI segment monetization. Despite improved mining efficiency and revenue growth, HUT posted a $253 million net loss in Q1 2026, with negative margins in its digital infrastructure segment. Material AI data center revenue is not expected until Q2 2027, while current share prices already reflect much of HUT's future potential. Hut 8 Corp ( HUT ) is one of the companies transforming its business to become an AI hosting provider. But HUT is not completely abandoning the bitcoin ( BTC-USD ) mining business, as it has a strategic mining partner in American Bitcoin ( ABTC ). This vision could be a little different from similar miners that are betting on becoming pure AI hosting providers. I wrote about this transformation in this article , where I compared the 10 main companies going through that process. Transforming this business is not easy for any company, and there are differences between each one. HUT focused more on leasing its land through long term contracts, known as triple-net leases. Other similar companies, although they also have long term agreements, were more focused on producing and offering cloud AI services, as is the case of IREN Limited ( IREN ). IREN already has an agreement with Microsoft ( MSFT ) and has NVIDIA as its strategic partner. Both hyperscalers ensure more stable monetization by hosting the cloud service. To find a similar approach to HUT, I think we should look at Riot Platforms ( RIOT ). But RIOT moves at a different rhythm and targets a different kind of client. While RIOT has a contract with Advanced Micro Devices ( AMD ), HUT has a much more strategic contract with Alphabet ( GOOG ) and its cloud infrastructure provider, Fluidstack, which also provides a guarantee for securing financing. So, almost all of these companies have the same goal: to monetize the AI boom and the need for optimal energy infrastructure. But if we can understand the differences in levels, we will also understand which ones will be more successful than others in the future. I mean: I believe they will all grow, but not at the same level or rhythm, and above all, perhaps not at the same prices. That's why I believe it is important to know when to buy. In this case, HUT is not in my portfolio, but of course I am paying attention to it. I believe there are additional risks associated with still relying on Bitcoin as a funding source, although in the last reported quarter, HUT improved its hashrate efficiency, allowing it to increase revenue. HUT shows net losses and a slightly more pronounced negative adjusted EBITDA than similar companies. This is normal in companies that are transitioning in their business, but regardless, I believe it's important to keep an eye on them. Finally, I believe HUT shares are a little expensive, with a huge rise of almost 100% so far this year. I am rating HUT as Hold, while I expect better results in the following quarters, or some price correction to change my perspective. Q1 2026: increased mining efficiency didn't prevent accounting losses in Bitcoin Q1 2026 results left some positive and negative things. I'll start with the positives: improved hashrate efficiency. The mining capacity went from 25.1 to 28.1 EH/s, while they also achieved a lower energy cost per mined coin. In addition, the HUT mining sites saw increased activity, which boosted the amount of Bitcoin mined from 135 in Q1 2025 to 817 in Q1 2026. In other words: bitcoin multiplied by 6. That's what allowed the company to compensate the fall of the average price of bitcoin, which went from $91.5k to $76k. Basically, that was a big boost to total revenue in the quarter, especially in the Compute segment. Hut 8 HUT has three revenue segments: Compute, Power, and Digital Infrastructure. But Compute represents almost 95% of revenue. Compute revenue was $66 million in Q1 2026 compared to $16 million in Q1 2025. On the other hand, the other segments remained constant. Power revenue decreased from $4.3 million to $3.7 million due to the divestiture in Far North, while Digital Infrastructure revenue remained at $1.3 million. Digital Infrastructure is the key segment for future revenue growth. That's where I see the core AI business and the monetization of the business transformation. I'd like to see in the following quarters an increase in its weight on total revenue. Hut 8 Despite the increase in total revenue, net losses increased to $253 million compared to $134 million in Q1 2025. This was due to losses on digital assets ($295 million), representing the decline in book value of HUT's bitcoin holdings, similar to the $248 million loss seen in 2025. The effect of losses in digital assets was also noted in the adjusted EBITDA of the quarter, as you can see in the image above, which is a metric I consider key to understanding whether these companies are well directed toward profitability. Another important metric I'm looking at in these companies that are trying to become AI hosting providers is gross margin. In this case, HUT has negative margins of 18% on its digital infrastructure segment, without counting depreciation and amortization. That's why my preliminary conclusion is that HUT's transformation is still in its early stages. That doesn't mean the company can't strongly monetize its current investment, it simply means it can't yet show even positive margins. I'll explain later HUT's plans, the facilities it seeks to leverage, and when it expects to achieve contract monetization and profit margins. Meanwhile, the gross margins for Power and Compute were 43% and 66% in Q1 2026, respectively. These margins should ensure the viability of the company's overall business as it undergoes this transition. To understand this transition, I analyzed its portfolio and its plans to become a pure AI data center. HUT Portfolio, investment plans, and monetization expectations Regarding HUT's installed capacity, it currently has 710 MW operational, and although management mentions a long term platform with a capacity of over 9 GW, I think it's important to clearly understand the breakdown of the categories. Hut 8 I'm including projects under construction with sales agreements (830 MW) and exclusive development agreements (1.68 GW). These would represent 3.2 GW of medium term agreements. The 5.3 GW shown in the earnings report slide are early-stage projects under evaluation, which I don't expect to come online in 2027 or 2028, for example. What I'm trying to say is: the current and concrete expansion plans, concentrated on the River Bend and Beacon Point sites, are projected to generate initial revenue by the second quarter of 2027. That is very far from the forecast that 70% of bitcoin mining revenue will come from AI data centers by the end of 2026. Hut 8 Part of the investment to increase the capacity of these sites came from $3.25 billion in debt raised in Q1 2026 through the issuance of senior bonds. The debt was allocated to River Bend and its structure seems solid, with an amortization period of 16.5 years, without the need to renegotiate rates and terms. Besides, it covers 95% of the build cost, which allowed HUT to recover $184 million. The coupon rate is 6.19% annually, a bit high for my taste, but understandable for a long-term business hoping to capitalize on the AI boom. I believe HUT pays a premium for the volatility of its bitcoin-related business model, but it compensates for this with its stable revenue plan by aiming to be a data center REIT. Hut 8 In line with the NNN contracts, with fifteen year terms, the annualized NOI (net operating income) would be $1.1 billion. The total projected value of the long term leases is $16.8 billion, but the company also presents a hypothetical bullish scenario of up to $42.8 billion. If the bullish scenario comes true, and the contract term remains at fifteen years, that would triple the annualized NOI. But I still can't take a bullish scenario as a basis for my analysis. For now, I believe the base case is sufficient to generate positive expectations. Regarding monetization timelines, Q2 2027 is the period mentioned on the conference call to start generating revenue. In line with my doubts about the digital infrastructure segment, Sean Glennan, CFO, precisely said it depends on the investment in River Bend and Beacon Point facilities. Q: Digital Infrastructure segment revenue was flat year-over-year. With River Bend and Beacon Point Phase 1 now commercialized, when should investors expect this to change? A: So Digital Infrastructure segment revenue was $1.3 million, which is consistent with the prior year period. Cost of revenue is also stable year-over year. However, again, going to the real story here, beginning in Q2 2027, the data halls at River Bend and Beacon Point Phase 1 are expected to come online. We expect this segment to become the primary growth driver, with contribution scaling materially as contracted, investment-gradebacked cash flows come online over time. Valuation: HUT trades at premium prices for its level of execution I believe HUT has some attractive catalysts, but the one I like the most is its transformation into an AI hosting provider. However, valuation multiples incorporate other factors related to the bitcoin mining business, and therefore its prices. The partnership with American Bitcoin and its ability to accumulate cryptocurrencies, I think also gives HUT's stock price a valuation premium. I mean: stock price may be discounting a significant portion of the bitcoin mining business, in addition to its future core function as an AI data center. It is not easy to value these kinds of companies, and even more when current revenue are still far from future expectations, and the losses prevent me from seeing their price to earnings ratio. As a reference, I used the price-to-sales multiple for valuation, which is not only relevant for HUT but also for its peers. But that's just a secondary reference. In my opinion, the volatility of these transforming bitcoin miners still affects valuation. Consider this as an approximation. HUT's stock is trading at 36 times its sales , while IREN, RIOT, and KEEL are trading at 19, 14, and 12 times their sales, respectively. I mean: other companies that are moving more decisively to abandon the bitcoin mining business seem not to have a premium in their share price. Author’s Tabulations Execution risks and dependence on hyperscaler CAPEX timelines As with similar companies, the timelines for implementing the planned energy infrastructure are among the main risks. Market prices, which are many years ahead of future earnings, I believe today reflect an execution that is on time, on track, and in line with revenue projections. Since the revenue thesis for AI data centers will not materialize until at least Q2 2027, the dependence on Bitcoin mining and its price also represents another type of risk. It's been a while since I started assuming volatility as a risk in my portfolio. If an asset is highly volatile, it falls into my personal high risk category. In the case of HUT, bitcoin revenue represents today, and will represent for at least one more year, the main source of cash flow. Beyond mining efficiency, losses on digital assets in Bitcoin holdings could continue to impact the balance sheet. Another risk related to execution is a moderation of hyperscaler CAPEX that could have an impact on monetization. This is a general risk of the industry, but it could be stronger for companies that take longer to monetize their investments, which in some cases are financed with debt from the hyperscalers themselves. Because of these kinds of risks, I think the sector expectations should be analyzed in detail for each company individually. All have the chance to exploit their energy infrastructure, but not all have the same execution plans. Conclusions HUT showed in Q1 2026 that it could be very efficient in bitcoin mining despite its transition toward AI data center hosting, but a bitcoin dependent business isn't what I'm looking for. What I want to see is greater focus and execution in energy infrastructure geared toward the future electrification boom, where data centers are key. I believe HUT could be a very attractive long term investment, like its peers, but I see some factors that are making me choose other companies. For example, the price of its shares seems to reflect a big part of its potential, both in bitcoin mining and in the AI data center thesis. The margins in its AI segment, through NNN contracts, are still negative, and according to management, stronger revenues won't be seen until the second quarter of 2027. So my rating is Hold, while I expect to see some corrections in prices and news about the execution of its transformation plan.
26 May 2026, 10:45
Binance to Remove Nine Spot Trading Pairs Including APT/ETH and WIF/FDUSD on May 29
BitcoinWorld Binance to Remove Nine Spot Trading Pairs Including APT/ETH and WIF/FDUSD on May 29 Binance, the world’s largest cryptocurrency exchange by trading volume, announced it will delist nine spot trading pairs on May 29 at 3:00 a.m. UTC. The affected pairs include APT/ETH, CTSI/BTC, DOT/ETH, FLOKI/FDUSD, MAV/USDC, S/BTC, SAGA/BTC, STEEM/BTC, and WIF/FDUSD. Why Binance Is Removing These Trading Pairs Exchanges routinely review and delist trading pairs to maintain healthy market liquidity and protect users. According to Binance’s official statement, the decision is based on factors such as low trading volume, poor liquidity, and overall market demand. Delisting a pair does not necessarily reflect on the underlying project’s quality but rather indicates that the specific trading combination no longer meets the exchange’s listing criteria. For traders, the removal of pairs like APT/ETH and DOT/ETH means they will need to use alternative routes—such as trading against USDT or BTC—to execute orders involving these assets. The delisting of FLOKI/FDUSD and WIF/FDUSD similarly narrows direct fiat-backed stablecoin options for those tokens. Timeline and Impact on Traders The delisting is scheduled for May 29, 2025, at 3:00 a.m. UTC. After this time, open orders for the affected pairs will be automatically canceled. Users holding positions in these pairs should close them before the deadline to avoid unexpected execution or settlement issues. Binance has not indicated any changes to the availability of the individual tokens themselves. For example, APT and ETH remain tradable on other pairs, such as APT/USDT or ETH/USDT. The delisting only removes the specific combination of two assets in a single order book. What This Means for the Broader Market Periodic pair delistings are a standard part of exchange operations and are not unique to Binance. However, the removal of pairs involving major tokens like DOT and APT may signal shifting liquidity patterns. Traders should monitor whether the delisted pairs’ underlying assets see any temporary volatility as liquidity consolidates into more popular trading routes. For projects like Saga (SAGA) and Maverick Protocol (MAV), which are newer and less established, losing a direct BTC or USDC pair could reduce their visibility among certain trader segments. Long-term holders are unlikely to be affected, but active traders may need to adjust their strategies. Conclusion Binance’s delisting of nine spot trading pairs on May 29 is a routine liquidity management action. While the removal may inconvenience some traders, it does not affect the underlying tokens’ availability on the exchange. Users are advised to review their open orders and adjust trading strategies accordingly before the deadline. FAQs Q1: Will my tokens be lost after the delisting? No. The delisting only removes the specific trading pair. Your tokens remain in your Binance wallet and can still be traded on other available pairs or withdrawn. Q2: Can I still trade APT and ETH after APT/ETH is delisted? Yes. APT and ETH are still available on other trading pairs, such as APT/USDT and ETH/USDT. Only the direct APT/ETH pair is being removed. Q3: What happens to my open orders on the delisted pairs? Binance will automatically cancel all open orders for the affected pairs at the time of delisting. It is recommended to close positions manually before the deadline to avoid any inconvenience. This post Binance to Remove Nine Spot Trading Pairs Including APT/ETH and WIF/FDUSD on May 29 first appeared on BitcoinWorld .
26 May 2026, 10:42
Bitcoin risks another lower high as stocks rally, AI tokens outperform
The bitcoin price chart is forming a potential lower high while ether languishes in a months-old range even as S&P 500 and Nasdaq 100 index futures push higher.
26 May 2026, 10:41
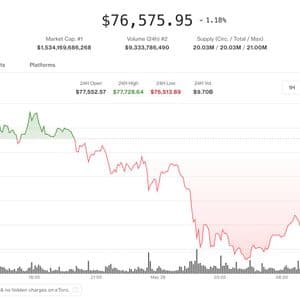
Is Bitcoin headed for $74K as ETF outflows and Iran risks rise?

Bitcoin has slipped below the $77,000 level in recent trading, extending a weak stretch that has been shaped more by institutional flows and macro shocks than retail speculation. The largest cryptocurrency is currently trading around $76,528, marking a 24-hour decline of roughly 1.2% and leaving it slightly lower over the week. At the same time, broader crypto market activity shows reduced participation, with total digital asset trading volume near $67.9 billion across exchanges. Bitcoin ETF outflows and institutional selling pressure intensify A key driver behind the latest downturn has been sustained outflows from US spot Bitcoin exchange-traded funds. Data from CoinGlass indicates that more than $1 billion has exited Bitcoin-focused ETFs over the past few days, with withdrawals concentrated in major funds such as BlackRock’s IBIT and Fidelity’s FBTC. This wave of redemptions has reduced spot demand from institutional investors who had previously been a major support pillar for Bitcoin’s rally earlier in the cycle. At the same time, derivatives markets have shown increased hedging activity. Large institutional Bitcoin put options have been executed in recent sessions, signalling demand for downside protection rather than fresh directional bets. Despite the selling pressure, flows are not entirely one-sided. Some public companies have continued to accumulate Bitcoin in smaller tranches, while Zonda Capital has expanded its exposure through US-listed Bitcoin ETFs. However, these inflows have not been enough to offset the scale of ETF redemptions. US defensive strikes in Iran weigh on BTC price Beyond institutional flows, Bitcoin’s decline has also been shaped by renewed geopolitical tension following US defensive strikes in southern Iran. The escalation has revived concerns over global oil supply routes, particularly through the Strait of Hormuz, adding inflationary pressure to already fragile risk markets. Market participants have increasingly treated Bitcoin alongside traditional macro assets, with its correlation to gold rising to approximately 88% during recent sessions. This shift highlights how sensitive BTC has become to broader risk sentiment rather than purely crypto-specific catalysts. The macro shock arrived as Bitcoin traded on a weakened technical footing after falling below its 200-day exponential moving average (EMA) earlier in the week. Since then, price action has centred on a critical support band between $76,000 and $76,590, which aligns with a key Fibonacci retracement zone. A brief recovery attempt has been repeatedly capped by low momentum and declining spot participation. Spot trading volume has dropped to multi-week lows, reflecting reduced conviction from both retail and institutional traders. Market observers note that liquidity conditions are thinner than earlier in the cycle, amplifying the impact of large sell orders and ETF-related redemptions. Near-term outlook hinges on the $76,000 support zone Market direction is now closely tied to two primary catalysts: progress in US–Iran diplomatic negotiations and the persistence of ETF outflows. A reduction in geopolitical tension or a reversal in institutional redemptions would likely be required to restore momentum in the short term. Until then, Bitcoin remains in a consolidation phase defined by heavy institutional influence, subdued spot activity, and heightened sensitivity to macroeconomic developments. At the moment, the immediate focus for traders remains the $74,456 support. Bitcoin price analysis Holding above this support could allow Bitcoin to stabilise and attempt a recovery toward the $78,000 region, where short-term resistance has formed. However, a sustained break below $74,456 would likely expose the market to a deeper pullback toward the $74,000 zone, which is the next major liquidity area, going by the recent price movements. The post Is Bitcoin headed for $74K as ETF outflows and Iran risks rise? appeared first on Invezz
26 May 2026, 10:40
Bitcoin Unable to Resume Rally Above $77K but This AI Coin Soars 25% Daily: Market Watch

Bitcoin’s price has failed to resume its rally, and it appears that the market has calmed down, or rather stalled, at about $77,000. This comes as legacy products like the S&P 500 continue to reach new all-time highs. Elsewhere, some altcoins are having a field day, with Worldcoin (AI) – a project associated with the founder of OpenAI, Sam Altman – exploding by 25% daily. Hopes for Bitcoin Price Rally Fade At the time of this writing, Bitcoin’s price is trading at slightly below $77,000. The cryptocurrency is down 0.6% for the past 24 hours and mostly flat for the week. This comes after a relatively calm 24 hours, during which BTC oscillated between $76.5K and $77K. It remains in correction mode, with price trending below the descending 200-day moving average near $80,000 and continuing to struggle to regain bullish momentum. After being rejected in the $82K area recently, BTC has returned to the support zone between $74K and $75K, where we see a convergence of prior demand, local lows, and the 100-day moving average. All of this comes amid rising stock market prices and tumbling oil, which just returned to $90 per barrel – a level we hadn’t seen in the past 20 days. It’s interesting to see how Bitcoin will fare in the current geopolitical environment, which is largely shaped by the war between the US, Israel, and Iran. Source: TradingView Worldcoin Leads Altcoin Markets, Soars 25% Daily Large-cap altcoins such as ETH, BNB, XRP, SOL, TRX, and others remain largely flat for the day, with movements in the -0.5% to +0.5% range. That said, AI-associated altcoins marked a notable move throughout the past 24 hours, with Sam Altman-related Worldcoin (WLD) up 28% so far. This brings its total gains to 60% for the week. The coin is followed by Render, up 16%, and the Artificial Superintelligence Alliance (FET), up by the same amount. This could be a beta trade in an AI-oriented infrastructure play against the popular DRAM ETF, which became the fastest-growing ETF in history, as reported by CryptoPotato yesterday. Source: Quantify Crypto The post Bitcoin Unable to Resume Rally Above $77K but This AI Coin Soars 25% Daily: Market Watch appeared first on CryptoPotato .


