


News
25 May 2026, 12:50
Singapore Dollar: UOB Maintains Range Trade Bias Against US Dollar

BitcoinWorld Singapore Dollar: UOB Maintains Range Trade Bias Against US Dollar United Overseas Bank (UOB) Group continues to hold a range trade bias for the Singapore dollar (SGD) against the US dollar (USD), indicating expectations for sideways movement rather than a clear directional breakout in the near term. UOB’s Outlook for SGD/USD According to UOB’s foreign exchange strategy desk, the current market dynamics suggest the SGD/USD pair is likely to trade within a defined range. The bank’s analysis points to a neutral stance, with no strong signals favoring a sustained appreciation or depreciation of the Singapore dollar against its American counterpart. This assessment comes amid a broader environment of mixed global economic data and cautious central bank policy expectations. The US dollar has shown resilience in recent weeks, while the Singapore dollar has been supported by the Monetary Authority of Singapore’s (MAS) steady policy stance and the city-state’s stable economic fundamentals. Key Levels and Market Context UOB’s technical analysis identifies specific support and resistance levels that define the expected trading band. While the exact boundaries were not detailed in the initial note, the bank’s range trade bias implies that the SGD/USD pair is unlikely to break out of its recent consolidation pattern without a significant catalyst. The Singapore dollar has been trading in a relatively tight range against the greenback, reflecting a balance between external headwinds—such as global inflation concerns and geopolitical uncertainties—and domestic resilience. The MAS manages the SGD against a basket of currencies, allowing for gradual adjustments rather than sharp moves. Implications for Traders and Investors For forex traders, UOB’s bias suggests a strategy of selling near the top of the range and buying near the bottom, rather than betting on a breakout. This approach is common in range-bound markets where momentum indicators are neutral and volatility is subdued. Investors with exposure to Singapore dollar-denominated assets may find some comfort in the relative stability, though they should remain alert to shifts in global risk sentiment or unexpected policy changes from the MAS or the US Federal Reserve. A sustained move above or below the identified range would signal a change in market dynamics. Conclusion UOB’s range trade bias for the Singapore dollar against the US dollar reflects a cautious, data-dependent outlook. With no clear catalyst for a directional move, the pair is expected to remain within a defined band in the near term. Traders and investors should monitor key economic releases and central bank commentary for potential shifts in this view. FAQs Q1: What does a range trade bias mean for the Singapore dollar? A range trade bias means that UOB expects the SGD/USD exchange rate to move sideways within a specific price band, rather than trending strongly up or down. Traders may look to buy near the bottom of the range and sell near the top. Q2: Why is UOB maintaining this bias? UOB’s bias is based on a lack of strong directional signals in the market. Factors include mixed global economic data, a resilient US dollar, and steady Singapore economic fundamentals, all of which contribute to a balanced outlook. Q3: What could change the range trade outlook? A significant change in US Federal Reserve policy, unexpected shifts in the MAS’s exchange rate stance, or major geopolitical or economic events could push the SGD/USD pair out of its current range, prompting a revised outlook from UOB. This post Singapore Dollar: UOB Maintains Range Trade Bias Against US Dollar first appeared on BitcoinWorld .
25 May 2026, 12:45
Bitcoin risks drop to $72K as demand metric hits 2026 lows

Bitcoin’s weakening demand failed to absorb increased selling pressure, raising risks of a further BTC price drop toward $72,000.
25 May 2026, 12:40
Gold Rebounds as Hopes for US-Iran Deal Weigh on US Dollar and Oil
BitcoinWorld Gold Rebounds as Hopes for US-Iran Deal Weigh on US Dollar and Oil Gold prices have staged a notable rebound in recent trading sessions, driven by a weakening US Dollar and falling Oil prices. The shift in market sentiment comes as renewed diplomatic efforts between the United States and Iran fuel hopes for a potential nuclear deal, reshaping the outlook for key commodities and currencies. Diplomatic Hopes Weigh on the Dollar The US Dollar Index (DXY) has retreated from recent highs, losing ground as traders price in a possible easing of geopolitical tensions in the Middle East. Reports of indirect talks and a more conciliatory tone from both Washington and Tehran have reduced demand for the greenback as a safe-haven asset. A weaker Dollar makes gold, which is priced in the US currency, more attractive to international buyers, providing a direct boost to bullion prices. Oil Prices Decline, Supporting Gold’s Appeal Crude Oil prices have also felt the pressure from the prospect of a US-Iran deal. A successful agreement could lead to the lifting of sanctions on Iranian oil exports, potentially adding significant supply to a global market already grappling with demand concerns. Brent crude has slipped below key support levels, and West Texas Intermediate (WTI) has followed suit. The decline in energy costs has broader implications, potentially easing inflationary pressures and reducing the need for aggressive monetary tightening by central banks. This environment is generally supportive for non-yielding assets like gold. Market Implications for Investors For investors, the correlation between these three assets—Gold, the US Dollar, and Oil—offers a clear signal of shifting risk appetite. The traditional inverse relationship between the Dollar and gold has reasserted itself. Meanwhile, the drop in Oil prices is being interpreted as a net positive for global growth, which in turn reduces the urgency for safe-haven positioning in the Dollar. However, analysts caution that the situation remains fluid. Negotiations are notoriously fragile, and any breakdown in talks could quickly reverse the current trends. Conclusion The rebound in gold reflects a broader recalibration of market expectations around US foreign policy and its ripple effects on currency and commodity markets. While the outlook remains dependent on the progress of diplomatic channels, the current price action suggests that gold is once again benefiting from its role as a hedge against Dollar weakness and shifting geopolitical landscapes. Traders will be closely watching for any concrete developments from the negotiating table. FAQs Q1: Why does a weaker US Dollar boost gold prices? Gold is priced in US Dollars. When the Dollar weakens against other currencies, it takes fewer of those currencies to buy the same amount of gold. This makes gold cheaper and more attractive for international buyers, increasing demand and pushing prices higher. Q2: How would a US-Iran nuclear deal affect Oil prices? A nuclear deal could lead to the lifting of economic sanctions on Iran, allowing the country to resume full-scale oil exports. This would increase global oil supply, which typically puts downward pressure on crude prices. Q3: Is the current gold rally sustainable? The sustainability of the rally depends heavily on the progress of US-Iran negotiations and broader macroeconomic data. If a deal materializes and the Dollar continues to weaken, gold could see further gains. However, a breakdown in talks or a surprise hawkish shift from the Federal Reserve could quickly reverse the trend. This post Gold Rebounds as Hopes for US-Iran Deal Weigh on US Dollar and Oil first appeared on BitcoinWorld .
25 May 2026, 12:38
Ethereum Price Prediction: ETH Battles 100-Day MA as $2K Support Holds the Key
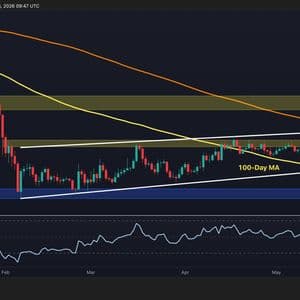
Ethereum is trading at $2,120 as the final week of May begins, caught in a tug-of-war with the 100-day MA that encapsulates everything frustrating about this cycle. Having briefly reclaimed the moving average in late April for the first time since the correction began, ETH surrendered it again during the May breakdown and is now trading just below it. Yet, the moving average is close enough that a single strong daily close could flip the script, but it has been unable to do so with the momentum currently available. The next few days will determine whether that reclaim sticks or the key $1.8K demand zone finally becomes the next topic of conversation. Ethereum Price Analysis: The Daily Chart On the daily chart, it is evident that ETH briefly reclaimed the declining 100-day moving average in late April, only to lose it again during the May breakdown. The price is now trading just below it at approximately $2.1K, with the 100-day moving average sitting a short distance overhead and acting as resistance once more rather than support. The RSI has also recovered from its low last week near 30 to approximately 40, which is a modest bounce with no directional conviction yet. The dynamic has shifted subtly but meaningfully, as this is no longer a case of the 100-day MA sitting far above as an aspirational target. It is close enough to touch, and the daily closes around $2.1K represent an ongoing battle to reclaim it. A sustained close above the moving average and the $2.2k level would confirm the reclaim and shift the structure back toward neutral. On the other hand, a close below $2,000 would simultaneously breach the ascending channel’s lower boundary, leaving $1.8k as the only remaining structural support before a full reassessment of the recovery thesis. Source: TradingView ETH/USDT 4-Hour Chart The 4-hour chart shows the price compressing into an increasingly tight range between the $2k support zone below and the $2.15k area overhead. The RSI is recovering from oversold territory to just above 50, which is enough to stabilize the market without yet generating upside momentum. The white ascending channel’s lower boundary at $2.08k converges with the lower boundary of the $2.15k resistance zone, making that band the last technical defense before $1.8k. The first meaningful target above is the $2.25k zone, which is the level that acted as support through most of April and early May before the breakdown. A 4-hour close back above it would signal that the worst of the selling pressure has passed and open a path toward $2.4k. Until that reclaim happens, the tight range between $2.15k and $2k is likely to continue as the market waits for a catalyst in either direction. Source: TradingView Sentiment Analysis ETH’s funding rate has been predominantly positive throughout most of the corrective phase, with only brief negative spikes rather than the sustained red dominance. The notable exception was late April, when funding tilted mostly negative for an extended stretch, which coincided with the period where price stalled repeatedly at $2.4k and eventually broke down. That negative phase appears to have cleared, as funding has returned to positive and has recently printed some of the higher green readings of the past two to three months. The current reading of +0.005 sits at the upper end of what has been a muted range. The timing of this shift matters. Funding turning aggressively positive while price is sitting at $2.1k, closer to the multi-month lows than to resistance, suggests that a fresh cohort of longs is building positions at current levels with conviction rather than chasing a breakout. The current setup is more structurally sound, as longs are accumulating near support rather than at the ceiling. Whether that conviction is rewarded depends entirely on whether the $2k channel floor holds and the 100-day moving average is reclaimed again. Source: TradingView The post Ethereum Price Prediction: ETH Battles 100-Day MA as $2K Support Holds the Key appeared first on CryptoPotato .
25 May 2026, 12:33
Bitcoin Continues Steady Decline: Is a Crash on the Horizon?

A steady decline of lower highs and lower lows over nearly three weeks has meant that the $BTC price is currently well back inside what is almost a 4-month long bear flag. With Bitcoin looking as though it may continue to subside, could the bears really take control and force this correction into a tailspin? Back into the channel or yet another rejection? Source: TradingView The short-term time frame for $BTC shows that the price is still bumping along below the descending channe l, having arrived at the underside of that channel once again. It is now up to the bulls to force the price back into the channel. If this does not happen, and the probabilities are for a rejection, the price would then fall through the ascending trendline and the next bearish phase could begin. If the bulls do surprise to the upside, the $78,000 resistance band overhead, together with the 200 SMA , are another obstacle to further price appreciation. Lending their signal to the bear case are the short-term Stochastic RSI momentum indicators. The 4-hour, 8-hour, and 12-hour indicators are right at the top of their range and therefore they are not far away from signalling negative price momentum as they roll over and come back down. Golden cross coming soon Source: TradingView The negative picture for the daily time frame is that the 200-day simple moving average (SMA) is coming down, to all intents and purposes to force the $BTC price back down. If another lower low is made, the current bearish phase will probably continue. In the RSI at the bottom of the chart, the indicator line has clearly dropped out of the last ascending channel and might be about to be rejected from the RSI-based moving average line (in yellow). All that said, the 50-day SMA is rising fast and is only a matter of a week or so away from crossing above the 200-day SMA, which would be a “golden cross” . Could this be the golden cross that initiates the next bull market? Bottom of the bear market to take place below 200-week SMA Source: TradingView The weekly chart with the main moving averages gives us food for thought. First, it must be noted that the current bear flag has been redrawn with a much sharper ascending angle, allowing for the price action to still be contained within. This would mean that the $BTC price would not have as far to go in order to drop out of the bottom. The 200-week, 100-week, and 50-week simple moving averages are still in their bull market order, with the 50-week above, the 200-week below, and the 100-week sandwiched between. However, it can be noted that the 50-week is falling quickly and is likely to fall below the 100-week in the next few weeks. That said, it still has a long way to go to get below the 200-week SMA, which was last achieved shortly into the new bull market early in 2023. As can be seen, it was around the 200-week SMA where most of the bottom price action of the last bear market took place. It would not be a surprise if this happened again, especially considering the 53 and 54 week lengths of the last two bear markets. So far in this bear market we are only out to 33 weeks. 54 weeks would take the end of this bear market out to mid-October. If this is going to be the case, it would be imagined that the current $60K bottom would be tested. The MACD indicator at the foot of the chart is showing a series of slightly shorter light green bars in the histogram. Are these bars going to turn red again, signalling more downside? Disclaimer: This article is provided for informational purposes only. It is not offered or intended to be used as legal, tax, investment, financial, or other advice.
25 May 2026, 12:30
Trader Opens $100M ETH Short at 23x Leverage on Hyperliquid With Liquidation Just 2% Away
A tracked onchain wallet has opened a 23x leveraged short position on ether worth $100.33 million via Hyperliquid, with the trade facing automatic liquidation if ETH climbs just $41 from its entry price. A Nine-Figure Bet Against Ether Wallet address 0x50b3 opened a 23x leveraged short on 47,604 ether ( ETH) at an implied entry


