


News
20 May 2026, 12:17
XRP Records 100% Uptick in U.S. ETFs, but 105-Day Sideways Drift Blocks Price Breakout

U.S. spot XRP ETF inflows jumped 100% to $1.48 million amid Senate CLARITY Act progress, but a 105-day consolidation keeps the token locked in accumulation.
20 May 2026, 12:10
Whale's Insight: U.S. Equities Rally To ATH - Why Hasn't Bitcoin Followed?

Summary U.S. equities hit all-time highs on AI and U.S.-China optimism, but BTC stays pinned near $80,000. CPI at 3.8%, PPI at 6.0%, and an untested new Fed Chair mean limited risk capital is reaching crypto. Spot BTC ETFs broke a six-week inflow streak: $635 million out on May 13, $1.26 billion over five days. JPMorgan boosted IBIT 174% in Q1, and the first U.S. Hyperliquid ETF launched on Nasdaq. Perpetual positioning at record net-short. Squeeze fuel building, catalyst still missing. U.S. equities are partying at all-time highs, but BTC can't break out of the $80,000 range, sitting 35-40% below last October's peak. This week: $635 million pulled from spot ETFs in a single day, $500 million in longs liquidated at the 200-day MA, and a new Fed Chair whose first move remains unknown. Yet beneath the surface, JPMorgan quietly tripled its Bitcoin ETF position, and perpetual shorts have hit record levels. Will Bitcoin stay stuck? U.S. Equities Rally to ATH. Why Hasn't Bitcoin Followed? U.S. equities are deep into a risk-on rally. The S&P 500 and Nasdaq continue to print record highs, with the Dow reclaiming the 50,000 level. AI momentum, strong corporate earnings, and optimism around U.S.-China cooperation following the Beijing summit are fueling aggressive equity inflows. Yet, Bitcoin ( BTC-USD ) remains range-bound near $80,000, roughly 35-40% below its October 2025 all-time high above $126,000. Source: @TheBTCTherapist The disconnect has become one of the most discussed questions among investors this week. Two factors explain the divergence: 1 - Bitcoin may have already priced in its risk cycle ahead of equities. As a 24/7 globally traded asset, Bitcoin reprices geopolitical shocks, liquidity shifts, and weekend headlines in real time, while equities wait for the next session open. When BTC hit $126,000 last October, leverage and greed were at extremes, followed by mass liquidations. That was crypto's version of peak risk appetite. U.S. equities, driven by AI trades and the China thaw, appear to be entering a similar euphoric phase now. Bitcoin is not lagging; it may have front-run this cycle. 2 - The real constraint is liquidity. Bitcoin is highly sensitive to global liquidity conditions. Rate cuts, QE expectations, and loose financial conditions drive crypto inflows. The current macro environment offers none of that. April CPI came in at 3.8% YoY, the highest since May 2023. The PPI print was even more striking: 1.4% MoM, the largest monthly jump since March 2022, with YoY at 6.0%, the highest since December 2022. Core PPI hit 5.2% YoY. The inflation pipeline is not cooling; it is accelerating. In this environment, limited risk capital flows to the highest-conviction trades first, which right now means U.S. large-cap tech and AI. The new Fed Chair adds uncertainty. Bitcoin is not without demand, but last week's upward momentum stalled this week as BTC settled back into consolidation near $80,000. Part of the reason may be that the market is front-running the uncertainty around Kevin Warsh's arrival as Fed Chair. Warsh was confirmed on May 13 in a 54-45 vote, replacing Jerome Powell, whose term ends May 15. Risk capital hates uncertainty above all else, and the new chair's policy leanings remain an open question. Warsh's first FOMC meeting is scheduled for June 16-17, and markets are watching whether he will lean toward cuts under political pressure or hold the line on inflation. The 10-year Treasury yield has climbed to 4.54%, its highest since May 2025. For Bitcoin to challenge its prior high above $126,000, a fundamental shift in the liquidity regime is required, and that has not arrived. ETF Inflows Snap, but Institutions Keep Buying the Dip U.S. spot Bitcoin ETFs recorded a $635 million single-day outflow on May 13, the largest since late January. BlackRock's IBIT accounted for nearly half. Over the past five trading days, the 11 listed funds have bled $1.26 billion in total, pulling cumulative net inflows since launch down to $58.5 billion from $59.76 billion a week earlier. The exit came on the same day as the hot PPI print and Warsh's confirmation, erasing in one week what took the March-April inflow streak six weeks to build. By May 15, flows had turned positive again at $131 million, with total net assets at $107.75 billion. The reversal suggests the outflow was reactive rather than structural, but whether inflows can sustain depends on macro conditions stabilizing. Institutions are still accumulating. JPMorgan's Q1 13F filing , published May 13, revealed the bank increased its IBIT holdings by 174% to 8.3 million shares, worth roughly $390 million at current prices. The bank also expanded exposure to Fidelity, Bitwise, and ProShares Bitcoin funds and added new positions in Solana staking and Ethereum-linked ETFs. This accumulation happened while BTC fell over 22% during Q1, indicating a deliberate buy-the-dip posture rather than momentum chasing. Morgan Stanley's spot Bitcoin ETF ( MSBT ), launched April 8, has recorded zero outflow days since inception and accumulated approximately $256 million to date. The altcoin ETF universe continues to expand. 21Shares launched the first U.S. spot Hyperliquid ETF ( THYP ) on Nasdaq on May 12, attracting $1.2 million in net inflows and $1.8 million in trading volume on day one. Analysts described the debut as "very solid" for an altcoin ETF. Bitwise and Grayscale are preparing competing HYPE products. The launch reflects a broader trend: regulated crypto exposure is diversifying beyond BTC and ETH into protocol-specific assets, expanding the institutional access surface. Leveraged Longs Flushed at the 200-Day Line On May 13, over $500 million in long positions were liquidated across the crypto derivatives market as the hot PPI print, BOJ hawkish signals, and Warsh's confirmation converged in a single session. The selloff was triggered at the 200-day moving average near $82,000, which has acted as key resistance throughout this rally. On-chain data adds context. As BTC approached $80,000, short-term holders realized profit spiked to $4 million per hour, roughly 4x the April baseline. The selling pressure from profit-taking overwhelmed buy-side demand at that level. The short-term holder cost basis distribution heatmap confirms dense supply concentration around $79,000-$82,000, making this zone a structural ceiling until absorbed. Looking at positioning, perpetual futures directional premium has flipped to a record net-short position. Historically, such extreme short-side crowding has often preceded inflection points. The fuel for a short squeeze is accumulating, but requires a catalyst. The liquidation heatmap reinforces this setup: dense short liquidation clusters sit above $82,000, while long liquidation concentration builds below $78,000. A decisive move in either direction will trigger cascading forced closures. Week Ahead Ongoing: CLARITY Act full Senate floor timeline; Ongoing: U.S.-China post-summit bilateral outcomes; May 20: FOMC Minutes (April 28–29 meeting); and May 22: UMich Consumer Sentiment, Final May The CLARITY Act now needs 60 votes on the full Senate floor, with direct implications for crypto-exposed equities like Coinbase and Circle. Watch for stock price volatility around the vote timeline. On the macro side, Wednesday's FOMC minutes deserve close attention. The April meeting saw four dissents, the most since 1992. Governor Miran voted for a cut; three regional presidents objected to language perceived as dovish. With CPI at 3.8% and the Iran energy shock unresolved, the minutes will reveal whether the internal split is merely about timing or whether rate hikes have formally entered the discussion. The U.S.-China summit is expected to yield cooperation frameworks across AI, energy, and trade. Monitor related statements closely. Disclaimer: The information provided herein does not constitute investment advice, financial advice, trading advice, or any other sort of advice and should not be treated as such. All content set out above is for informational purposes only. Original Post
20 May 2026, 12:00
Algorand rallies off Robinhood news, keeps April’s bullish breakout going

Algorand raced higher by nearly 7% for the day following news that ALGO trading was live on Robinhood.
20 May 2026, 11:59
Ethereum whales drop 7 percent as price nears $2,000

🚨 The number of $ETH whales dropped by 7 percent to 1,030. Ethereum’s price is testing the $2,100 support and risks falling to $2,000. Continue Reading: Ethereum whales drop 7 percent as price nears $2,000 The post Ethereum whales drop 7 percent as price nears $2,000 appeared first on COINTURK NEWS .
20 May 2026, 11:58
Ripple (XRP) Price Predictions for This Week
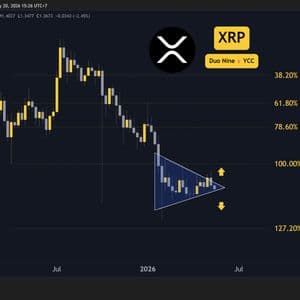
XRP failed its breakout and is now under $1.4. How low will sellers take it? Ripple (XRP) Price Predictions: Analysis Key support levels: $1.2, $1 Key resistance levels: $1.4, $1.6, $2 Breakout Failure Led to Reversal Initially, XRP broke above the blue pennant, triggering a bullish move and optimism. However, since then, the price fell back into the pennant and also broke below the key support at $1.4. This price action could be interpreted as a bullish trap with a full reversal that puts sellers in charge. As long as $1.4 acts as resistance, lower lows are likely with $1.2 and $1 as key targets for bears. Source: TradingView Sellers Return With the price unable to hold above $1.4, the chart turned bearish, and sellers have the upper hand right now. The drop under $1.4 was due to increasing sales volume, which gives confidence in this move. If the price falls below the blue pennant, XRP is likely to make new lows and will probably struggle to contain selling pressure. Buyers could, however, make a stand around $1.2. Any failure there would open the way to $1. Source: TradingView MACD Showed Weakness During the initial rally, the MACD formed lower histogram highs. This was an early bearish divergence, showing buyers don’t have the strength to sustain this uptrend. This weakness was now exposed by the price, which failed to hold above $1.4. Moreover, the MACD moving averages are curving down and may soon do a bearish cross, which could keep the chart in a downtrend for some time. Source: TradingView The post Ripple (XRP) Price Predictions for This Week appeared first on CryptoPotato .
20 May 2026, 11:56
Bitcoin (BTC) on the Edge: 23% Rally or 30% Crash Comes Next?

The primary cryptocurrency, which performed quite well towards the end of April and beginning of May, has tumbled by 5% over the past week, sparking fears that the bottom of the bear cycle has yet to be reached. One popular analyst believes that its eventual breakout would heavily depend on holding a critical support level. Big Jump or Major Collapse? Ali Martinez – a renowned analyst who often makes BTC predictions after observing certain technical indicators and factors – once again chipped in. This time, he paid special attention to the Market Value to Realized Value (MVRV) pricing bands and envisioned a rally to almost $95,000 should the asset’s valuation hold above $72,960. At the same time, Martinez claimed that falling below this key zone could trigger a major pullback to just under $55,000, representing a 30% crash from today’s price. In a separate post, the X user revealed that BTC’s MVRV ratio has plunged below its 180-day SMA. Unlike traditional models, which see this development as a cooling phase, Martinez views it as “a shift toward a high-conviction accumulation zone.” “When the MVRV ratio sits below the 180-day moving average, it means the market is effectively flushing out premium and pricing in a deep discount. Historically, these specific periods mark the exact foundation on which long-term smart money builds its positions. As long as the ratio consolidates under this 180-day line, the short-term trend will remain compressed, offering a highly strategic accumulation window,” he explained. The latest activity of the big investors supports the bullish outlook. As CryptoPotato reported , the number of market participants holding at least 100 BTC has increased to 20,229. This represents an 11% increase compared to the 18,191 wallets recorded in May 2025. Such a development shows that these big shots are confident in the asset and position themselves for a potential price pump in the future. This could have a psychological effect on smaller players, who may follow suit and inject fresh capital into the ecosystem. Is History Repeating? Meanwhile, other analysts made pessimistic forecasts and expect BTC to post a painful decline in the short term. Among those is X user Chiefy, who argued that the asset is entering the exact same pivot zone that appeared during the 2022 market meltdown. They reminded that back then, many people described the crash as a “healthy correction,” suggesting that now history is repeating. If that is indeed the case, BTC could tumble to as low as $45,000 in the coming months. Another worrying factor is the rising amount of coins stored on crypto exchanges. CryptoQuant’s data show the figure currently stands at almost 2.7 million, close to the monthly high reached earlier this week. This shift suggests that some investors have abandoned self-custody methods in favor of centralized platforms, thereby increasing immediate selling pressure. BTC Exchange Netflow, Source: CryptoQuant The post Bitcoin (BTC) on the Edge: 23% Rally or 30% Crash Comes Next? appeared first on CryptoPotato .


