
Coin info
Rank
Market Cap
Volume (24h)
Circulating Supply
Total Supply
Do you think the price will rise or fall?
Rise 40%
Fall 60%
Price perfomance
$0.00
0%
$∞
Range 24H
$∞
Depth of Market
Depth +2%
Depth -2%


PRICE
+7.48%
$95.43
PRICE
+5.34%
$0.008642
PRICE
+3.69%
$1.99

PRICE
+3.28%
$2.08

PRICE
+3%
$0.09097

PRICE
+2.56%
$0.005291

PRICE
+2.48%
$1.03

PRICE
+2.04%
$0.3365

PRICE
+1.86%
$0.07524
PRICE
+1.76%
$3.21

PRICE
+1.76%
$0.001642

PRICE
+1.67%
$1.6

PRICE
+1.55%
$63,651.16

PRICE
+1.51%
$0.006768

PRICE
+1.41%
$0.053

PRICE
+1.35%
$6.78

PRICE
+1.21%
$9.42

PRICE
+1.05%
$81.85

PRICE
+1.04%
$57.27

PRICE
+1.01%
$1.15
PRICE
+1.01%
$2.23

PRICE
+1.00%
$0.7956

PRICE
+0.97%
$2,221.08

PRICE
+0.85%
$1,791.1

PRICE
+0.83%
$0.054

VOL24
+18,992.53%
$0.9998
VOL24
+2,019.7%
$1.03

VOL24
+738.69%
$1.0000

VOL24
+680.33%
$1.01

VOL24
+532.13%
$0.9998
VOL24
+467.29%
$0.008642

VOL24
+447.25%
$0.1991

VOL24
+340.55%
$4,147.71

VOL24
+262.96%
$0.9988

VOL24
+226.71%
$0.9989

VOL24
+216.57%
$0.9986

VOL24
+210.49%
$1.0000

VOL24
+193.6%
$4,159.19
VOL24
+155.38%
$0.9998

VOL24
+139.02%
$71.19

VOL24
+137.01%
$79.67
VOL24
+126.97%
$57.27
VOL24
+119.51%
$63,651.16
VOL24
+112.83%
$2.08

VOL24
+109.52%
$0.052

VOL24
+106.07%
$0.9988
VOL24
+100.88%
$95.43
VOL24
+100.45%
$1,792.5
VOL24
+93.91%
$6.78

VOL24
+93.4%
$0.9992
PRICE
+7.48%
$95.43
PRICE
+5.34%
$0.008642
PRICE
+3.69%
$1.99
PRICE
+3.28%
$2.08
PRICE
+3%
$0.09097
PRICE
+2.56%
$0.005291
PRICE
+2.48%
$1.03
PRICE
+2.04%
$0.3365
PRICE
+1.86%
$0.07524
PRICE
+1.76%
$3.21
PRICE
+1.76%
$0.001642
PRICE
+1.67%
$1.6
PRICE
+1.55%
$63,651.16
PRICE
+1.51%
$0.006768
PRICE
+1.41%
$0.053
PRICE
+1.35%
$6.78
PRICE
+1.21%
$9.42
PRICE
+1.05%
$81.85
PRICE
+1.04%
$57.27
PRICE
+1.01%
$1.15
PRICE
+1.01%
$2.23
PRICE
+1.00%
$0.7956
PRICE
+0.97%
$2,221.08
PRICE
+0.85%
$1,791.1
PRICE
+0.83%
$0.054
VOL24
+18,992.53%
$0.9998
VOL24
+2,019.7%
$1.03
VOL24
+738.69%
$1.0000
VOL24
+680.33%
$1.01
VOL24
+532.13%
$0.9998
VOL24
+467.29%
$0.008642
VOL24
+447.25%
$0.1991
VOL24
+340.55%
$4,147.71
VOL24
+262.96%
$0.9988
VOL24
+226.71%
$0.9989
VOL24
+216.57%
$0.9986
VOL24
+210.49%
$1.0000
VOL24
+193.6%
$4,159.19
VOL24
+155.38%
$0.9998
VOL24
+139.02%
$71.19
VOL24
+137.01%
$79.67
VOL24
+126.97%
$57.27
VOL24
+119.51%
$63,651.16
VOL24
+112.83%
$2.08
VOL24
+109.52%
$0.052
VOL24
+106.07%
$0.9988
VOL24
+100.88%
$95.43
VOL24
+100.45%
$1,792.5
VOL24
+93.91%
$6.78
VOL24
+93.4%
$0.9992
Rise 40%
Fall 60%

$0.00004934
#7351
$49,902
$429,072
1,000,000,000
1,000,000,000
9 Jun 2026, 14:54

The deal underscores the trend of traditional asset managers backing DeFi infrastructure, following BlackRock's Uniswap and Apollo's Morpho investments.
9 Jun 2026, 13:16
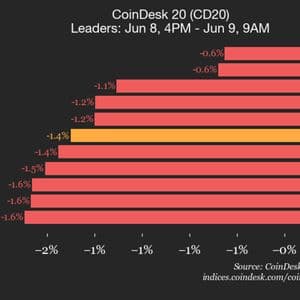
Uniswap (UNI), down 2.9% from Monday, joined Aave (AAVE) as an underperformer.
5 Jun 2026, 22:44
🔥 Uniswap set a new record by burning 134000 $UNI tokens in a single day. 🌐 The burn is part of the platform’s ambitious UNIfication mechanism now running on 11 blockchains. 🪙 $UNI is still trading far below its all time high despite record activity. Continue Reading: Uniswap sets record with 134000 UNI tokens burned in a day! What does this signal for Ethereum and DeFi investors? The post Uniswap sets record with 134000 UNI tokens burned in a day! What does this signal for Ethereum and DeFi investors? appeared first on COINTURK NEWS .
5 Jun 2026, 21:00
Hayden Adams, the creator of Uniswap, recently compared today’s market conditions to the 2018 bear market that produced Uniswap itself. He also declared that he is “extremely bullish on DeFi and Ethereum.” The declaration came one day after Uniswap trackers reported that the protocol burned a record daily total of 134,000 tokens due to a process approved by Uniswap Labs and the Uniswap Foundation, passed in late 2025, called UNIfication. How do the UNI token burns work? Hayden Adams, the creator of Uniswap, recently posted on X that he is extremely optimistic about DeFi and Ethereum. He compared today’s market to Uniswap’s origin days, “when Ethereum sentiment was at all time lows.” He stated that Uniswap and other DeFi projects proved Ethereum’s capabilities by building through that cycle, which helped lead to the DeFi summer of 2020. UNI token burns recently hit new highs, and Uniswap Labs released several product updates. Despite this activity, UNI still trades at $2.47 , which is more than 92% below its all-time high of $44.97 from May 2021. The token’s market cap sits at $1.54 billion with a circulating supply of 622.71 million UNI. The recent burn activity comes from a governance plan that Uniswap Labs and the Uniswap Foundation passed in late 2025 called UNIfication . UNIfication starts when protocol fees are collected and held in on-chain contracts called TokenJar. If someone wants to claim those fees, they must first burn an equal value of UNI tokens through a contract called Firepit. Finally, the burned tokens are sent to a dead address on Ethereum (0xdead), removing them from circulation forever. When the original UNIfication proposal was announced in late 2025, UNI jumped from $4.95 to $9.25 within a week. The UNI Burn Bot reported today that 134,000 UNI were burned in a single 24-hour period yesterday. This is a new daily all-time high for the program. Earlier this year in May, a governance vote (Proposal 96) approved extending the fee collection and token burns to BNB Chain, Polygon, and Celo, bringing the total number of chains using the burn mechanism to 11, in addition to Ethereum. Uniswap announces new product features At the same time, Uniswap Labs announced several product updates designed to make the platform easier for everyday users. The four main updates include in-app wallets, cross-chain swaps, portfolio tracking, and multichain portfolio views. All four features are live with zero interface fees on swaps. Uniswap Labs said it conducted internal research that showed that 49.9% of new traders on Ethereum, Arbitrum, and Base who swapped in 2026 made their first-ever swap on Uniswap. Uniswap holds $2.86 billion in total value locked (TVL) across more than 40 chains, with cumulative fees reaching $5.59 billion since it launched. However, the revenue going directly to UNI holders through the burn is $14.15 million total. Annualized fees currently run at roughly $882 million. Ethereum accounts for $1.96 billion of the TVL, followed by Base at $416 million and Arbitrum at $198 million. The smartest crypto minds already read our newsletter. Want in? Join them .


