


 Invest ideas
News
22 May 2026, 07:53
Bitcoin ticks down near $77k, set for weekly loss amid Iran peace uncertainty

22 May 2026, 07:51
Aptos (APT) And Sui (SUI): As More Move DeFi, Perps And Gaming Titles Launch, Do APT And SUI Start Holding Liquidity Through Rotations Or Stay High‑Beta Alt‑VM ...

The alternative Virtual Machine (alt-VM) landscape is rapidly maturing. Driven by the safety and parallel execution capabilities of the Move programming language, both Aptos (APT) and Sui (SUI) are seeing a steady influx of decentralized exchanges, perpetual protocols, and Web3 gaming titles. For developers and marketers operating in Web3 hubs like Sathorn, the technical narrative is compelling. However, the price charts reveal a stark difference in how the market is treating these two networks. Are these ecosystems finally capturing "sticky" liquidity that holds through broader market rotations, or are they still functioning purely as high-beta, campaign-driven side bets? Aptos (APT): Mid‑Range, Leaning Toward Support Source: tradingview Aptos is currently exhibiting technical weakness, trading dangerously close to its 30-day structural floor. It has retraced heavily from its recent local high and is struggling to find buyers willing to defend the mid-range. The Fibonacci Map ($0.945 to $1.15): 23.6% Retracement: $0.995 38.2% Retracement: $1.023 50.0% Retracement: $1.047 61.8% Retracement: $1.071 Immediate Support: $0.945 to $0.950: APT is currently leaning heavily on its 30-day swing low ($0.945). The latest daily closes sit squarely in this band. A definitive close below $0.945 invalidates the entire 30-day swing and points to a deeper, structural reset for the token. Immediate Resistance: $0.996 to $1.02: This is the primary "mean-reversion" zone. It contains the 23.6% and 38.2% Fibonacci retracements, with the 30-day SMA ($0.993) acting as an immediate ceiling just below it. APT must reclaim this territory to look technically healthy. $1.05 to $1.07: The 50% and 61.8% levels. Pushing through this block clears the mid-range and sets up a legitimate retest of the $1.15 highs. The Read: Aptos is hugging its 30-day floor. This is not the signature of an asset "holding liquidity through rotations." For APT to shed its high-beta side-bet status, it must repeatedly defend the $0.945 level without breaking down, and slowly grind back above its $0.993 moving average. Sui (SUI): Still Above Key Fibs, Mid‑Trend Cooling Source: tradingview In contrast to Aptos, Sui is demonstrating much stronger structural resilience. Despite a recent pullback from its highs, it remains comfortably mid-range and is holding key technical levels. The Fibonacci Map ($0.918 to $1.33): 23.6% Retracement: $1.015 38.2% Retracement: $1.075 50.0% Retracement: $1.124 61.8% Retracement: $1.172 Immediate Support: $1.02 to $1.08: This is the critical "trend support band." SUI's current price (~$1.08) sits just above the 38.2% Fib. More importantly, the 30-day SMA ($1.03) is sloping upward below the price, offering dynamic support alongside the 23.6% Fib ($1.015). As long as daily closes remain above $1.02, SUI is executing a controlled, healthy retracement. $0.92 to $0.95: The 30-day swing low. A break below this level resets the entire leg and signals a broader de-risking event across Move chains. Immediate Resistance: $1.12 to $1.18: This band houses the 50% and 61.8% retracements. If SUI can move into this zone and treat it as a consolidation base rather than a sell-wall, it proves that buyers are actively accumulating at mid-range prices. The Read: Sui is in a much healthier position than Aptos. It sits above its short-term moving average and is defending the 23.6%–38.2% Fibonacci band. This structure is indicative of an asset that is successfully cooling off mid-trend while retaining its core liquidity. Conclusion: Do They Start Holding Liquidity Or Stay Side Bets? The charts provide a clear divergence in how the market views the two leading Move-VM chains following their recent ecosystem expansions. They Start Holding Liquidity Through Rotations If: APT firmly defends the $0.945 floor, reclaims the $0.996–$1.02 resistance band, and begins printing higher lows toward $1.05. SUI continues to defend the $1.02–$1.08 support block, pushes back into the $1.12–$1.18 range, and spends the majority of its time consolidating above $1.10. Move-native DeFi, perpetual DEX volume, and gaming TVL consistently grow independently of isolated incentive campaigns. They Stay High-Beta Alt-VM Side Bets If: APT breaks its $0.945 floor and begins living in a lower trading tier. SUI loses its $1.02 trend support and inevitably gravitates back toward the $0.92–$0.95 swing lows. The technical charts confirm that liquidity on these networks remains highly campaign-sensitive, entering for points and airdrops but exiting immediately during broader market rotations. Disclaimer: This article is provided for informational purposes only. It is not offered or intended to be used as legal, tax, investment, financial, or other advice.
22 May 2026, 07:51
LIVE – Crypto News, May 22: Happy Bitcoin Pizza Day! BTC USD Battling Support, ETH Morale at Rock Bottom

As we celebrate Bitcoin Pizza Day today, the crypto market remains dynamic with BTC USD continuing to battle key support levels and ETH experiencing low morale among investors on social platforms, especially on crypto Twitter. Community spirit is high despite the pressures. For a refresher, we celebrate this day to commemorate the historic May 22, 2010, transaction, when programmer Laszlo Hanyecz made the first real-world commercial purchase by trading 10,000 Bitcoin for two Papa John’s pizzas. At the time, those 10,000 Bitcoin were worth just under $50. This milestone reminds us of Bitcoin’s journey from obscurity to a global asset. Bitcoin (BTC) 24h 7d 30d 1y All time Bitcoin Pizza Day: Honoring Crypto History During Volatile Times Despite current market fluctuations, Bitcoin Pizza Day serves as a powerful reminder of Bitcoin’s revolutionary potential and long-term endurance in the face of volatility. It encourages us to reflect on fundamentals and to forget its short-term price swings, especially today . As we know, May has been a great month historically for crypto, with BTC averaging 18%, with Q2 showing more monstrous green at 26% average. BTC quarterly return, Coinglass Bitcoin Pizza Day celebrations continue to boost community spirit even in uncertain times, renewing optimism that could help sustain engagement across the entire crypto ecosystem. While altseason appears delayed, it is certainly not canceled, as historical patterns around Bitcoin Pizza Day frequently show shifts toward market run in altcoins. Even today, we saw the XRP network added 4,300 wallets in just one day, resulting in a fresh bullish sentiment. Such growth in user activity likely precedes a bullish run. Discover: The best pre-launch token sales BTC USD Trends: Institutional Activity and Market Pressures The BTC USD pair faced a huge continuous pressure this week as Bitcoin and Ethereum ETFs recorded a very bad week with notable outflows. At the same time, Hyperliquid posted big inflows, a contrasting positive signal. HYPE ETF DEMAND IS EXPLODING, ATTRACTING $70M SINCE LAUNCH Spot Hyperliquid ETFs have pulled in $69.6 MILLION since launch, including a massive $25M yesterday and another $16.1M today alone. $HYPE has surged nearly 50% since the spot ETFs launched on May 12. pic.twitter.com/7YTeBM3AMc — Coin Bureau (@coinbureau) May 22, 2026 To make it look worse, the “crypto President” linked firm, Trump Media, reportedly saw its BTC holdings decline a lot, reflecting challenges in corporate crypto treasury management and highlighting risks tied to concentrated holdings during market dips. In contrast, Michael Saylor believes BTC will outrun the SP500 by 30 percent, delivering a strong bullish long-term view that counters near-term concerns. But there are rumors circulating that Saylor’s Strategy might dump its Bitcoin holdings soon, fueled by comments from Mark Cuban, who sold most of his BTC after it failed to act as the fiat inflation hedge he expected. These all add another layer of speculation. Litecoin Fires Back After Cuban Bitcoin Exit Mark Cuban ( @mcuban ) revealed he sold most of his Bitcoin $BTC holdings, claiming the asset has drifted away from its original vision. Litecoin ( @litecoin ) responded by defending Bitcoin’s core principles while criticizing financial… pic.twitter.com/ABj50arP4I — BSCN (@BSCNews) May 22, 2026 Private credit defaults have also reached an all-time high in USD, adding macroeconomic headwinds that continue to influence risk assets, including BTC and ETH. There are potential spillover effects. Hyperliquid posting big inflows stands out as encouraging amid the BTC USD struggles and ETF weakness, suggesting smart capital may still be rotating into on-chain opportunities despite the current sentiment. Discover: The best crypto to diversify your portfolio with ETH USD Outlook: Low Morale but Signs of Resilience Ethereum (ETH) 24h 7d 30d 1y All time ETH USD morale on Crypto Twitter has plunged to rock bottom following reports that Bankless sold holdings for ZEC, soon followed by Harvard unloading its stack too. Such moves have weighed heavily on sentiment. But Tom Lee believes fresh money will flow into alt assets like crypto, potentially providing the catalyst needed to improve ETH USD conditions over the coming months. BREAKING : Ethereum Harvard dumps entire $ETH position worth $87 Million pic.twitter.com/lFq5BXlAZA — Barchart (@Barchart) May 21, 2026 Also today, Ethereum celebrates 72.8 million monthly users despite ongoing USD price weakness, showing that it is not all doom and gloom for ETH and highlighting strong underlying network adoption. This positive user growth in the Ethereum ecosystem provides a solid foundation for potential recovery in the ETH USD pair. It also acts as a reminder that real-world usage often diverges from short-term price action. Overall, the crypto market on this Bitcoin Pizza Day shows a mix of challenges and opportunities, with BTC USD under pressure yet supported by optimistic forecasts, while ETH sentiment may soon benefit from alt inflows and robust user metrics. Discover: The best crypto to diversify your portfolio with The post LIVE – Crypto News, May 22: Happy Bitcoin Pizza Day! BTC USD Battling Support, ETH Morale at Rock Bottom appeared first on Cryptonews .
22 May 2026, 07:45
Solana (SOL) And Jupiter (JUP): As Solana DEX And Perp Volumes Pick Up Again, Do SOL And JUP Emerge As The Default On‑Chain Trading Combo Or Keep Sharing Liquid...

Solana (SOL) and Jupiter (JUP) are increasingly viewed as the default pair when discussing decentralized trading on the Solana network. SOL acts as the underlying layer-1 rail and primary collateral/gas asset, while JUP serves as the leading DEX aggregator and launchpad ecosystem token. With decentralized exchange and perpetual futures volumes ticking up on Solana once again, the critical question is whether this duo can behave as a self‑contained, dominant trading stack, or whether trading flows will continue to route heavily through cross‑chain and Ethereum Layer-2 aggregators. By examining recent ranges, key Fibonacci levels, and technical charting structures, we can map out exactly what the market is signaling. Solana (SOL): Large‑Cap Leader At Mid‑Range Source: tradingview Using Solana ’s typical 30‑day structural behavior as a baseline, we can observe how it navigates its current consolidation band. Swing High: ~$190 Swing Low: ~$145 Latest Close: ~$160 30‑Day SMA Proxy: ~$165 The Fibonacci Map ($145 to $190): 23.6% Retracement: $155.6 38.2% Retracement: $162.2 50.0% Retracement: $167.5 61.8% Retracement: $172.9 Immediate Support: $155–$156: The 23.6% Fibonacci band. This is the first "buy-the-dip" zone if the current uptick cools down. $145–$148: The 30-day swing low region. Losing this floor would mark a much deeper structural reset. Immediate Resistance: $162–$168: This cluster contains the 38.2% and 50% retracements, alongside the 30-day Simple Moving Average (SMA). A daily close above $167–$168 is the first signal that SOL is leaving the mid-range and targeting the upper band. $173–$190: The 61.8% Fib and the local high. Reclaiming this area and turning $173–$180 into support is exactly how SOL would prove it is back in a macro leadership trend, rather than just chopping sideways. The Read: SOL is currently mid-range in a $145–$190 channel, sitting slightly below its 30-day mean. For the SOL + JUP pair to look like the undisputed default trading stack, SOL needs to hold $155 on pullbacks, climb through $162–$168, and spend significant time "living" in the $173–$190 zone while DEX/perp volumes rise. Jupiter (JUP): DEX Aggregator Beta Near Shallow Fib Support Source: tradingview Jupiter 's technical structure mirrors its role as the high-beta aggregator token built on top of Solana's liquidity. Swing High: ~$1.45 Swing Low: ~$0.95 Latest Close: ~$1.10 30‑Day SMA Proxy: ~$1.18 The Fibonacci Map ($0.95 to $1.45): 23.6% Retracement: $1.07 38.2% Retracement: $1.14 50.0% Retracement: $1.20 61.8% Retracement: $1.26 Immediate Support: $1.07–$1.10: The shallow Fib zone. Holding this band keeps JUP in a healthy, "normal pullback" posture following its prior run. $0.95–$1.00: The swing low region. A break below $0.95 would signal a complete, 100% retracement of the last 30-day leg. Immediate Resistance: $1.14–$1.20: The 38.2% to 50% Fib cluster, which also houses the 30-day SMA. A close above $1.20 demonstrates that buyers are treating the recent dip as a buying opportunity rather than an exit window. $1.26–$1.45: The 61.8% retracement and the local high. This is the "upper trading stack" zone. Historically, JUP and SOL both reaching the top of their 30-day bands simultaneously coincides with massive, ecosystem-wide volume spikes. The Read: JUP is resting directly on shallow Fib support, bruised but not broken. To behave like the default DEX leg, it must defend $1.07–$1.10, reclaim $1.14–$1.20 with rising volume, and consolidate above $1.26. Default On‑Chain Trading Combo Or Shared Liquidity? Putting the level maps together provides a clear picture of the sector's current momentum. SOL sits mid-range, slightly below its SMA30 but above shallow support. JUP sits similarly near its first support tier, tightly coiled under its moving average. They Emerge as the Default Trading Combo If: SOL defends $155, reclaims the $162–$168 mean-reversion band, and probes the $173–$190 ceiling alongside growing on-chain volumes. JUP holds $1.07–$1.10, breaks above $1.14–$1.20, and spends the majority of its time trading above $1.26. Cross-chain aggregators and bridging protocols increasingly route net-new capital into Solana and Jupiter, rather than Solana simply acting as one of many temporary routing stops. They Keep Sharing Liquidity With L2 Aggregators If: SOL continually bounces between $145 and $168 without sustaining any time above the $173 threshold. JUP repeatedly stalls at the $1.14–$1.20 resistance block and drifts back to test the $1.00 floor. On-chain volume data reveals that Ethereum Layer-2s (Arbitrum, Base, Optimism) continue to capture a comparable or accelerating share of active perpetual and spot trading. Final Verdict: Right now, the numbers dictate that SOL and JUP are well-positioned but remain squarely in consolidation. The Fibonacci structures show that a strong next leg is entirely possible but not yet confirmed. Ultimately, whether they become the undisputed dominant stack will depend on price breaking those upper resistance bands while actual user flow aggressively migrates away from the L2 landscape. Disclaimer: This article is provided for informational purposes only. It is not offered or intended to be used as legal, tax, investment, financial, or other advice.
22 May 2026, 07:34
HBAR ETF Narrative: Can Enterprise Blockchain Tokens Come Back?

HBAR has re-entered market chatter thanks to a new wave of exchange-traded fund (ETF) speculation. The pitch is simple: if spot Bitcoin and Ethereum ETFs unlocked new demand, could a Hedera (HBAR) vehicle do the same—and reignite the broader “enterprise blockchain” theme? It’s a compelling story, but ETF paths are shaped by regulation, liquidity, custody, and market structure. Enterprise tokens also face a unique question: does corporate adoption actually translate into token demand? This guide disentangles narrative from mechanics. You’ll find the hurdles an HBAR ETF would need to clear, how enterprise blockchains can create value, what to monitor on-chain, and how to avoid common traps when trading an ETF rumor cycle. PointDetails HBAR ETF statusThere is no approved HBAR spot ETF in major markets at the time of writing; any “HBAR ETF” talk is a narrative, not a fact. Approval hurdlesRegulatory classification, robust spot-market surveillance, deep liquidity, institutional custody, and clear price discovery are prerequisites. Enterprise token valueAdoption can drive demand, but fee abstraction, grants, and centralized governance may weaken token-value linkage if not designed carefully. Potential catalystsReal-world asset tokenization, sustainability reporting, and compliant data anchoring could support enterprise networks with utility-focused tokens. Key risksUnlock schedules, regulatory actions, low-float volatility, and fake ETF headlines can hurt late buyers during narrative spikes. Actionable checklistTrack filings, watch ETP flows in Europe, verify on-chain usage, and size positions conservatively while liquidity remains uneven. What the “HBAR ETF narrative” actually means When traders say “HBAR ETF,” they usually mean two things: first, that a fund issuer could file for a spot product giving traditional investors HBAR exposure; second, that such a listing might catalyze new demand and re-rate the token. Neither outcome is guaranteed, nor imminent without visible filings and regulator sign-off. ETF chatter vs. concrete steps A credible path involves two public milestones in the United States: an exchange’s 19b-4 rule-change proposal and an issuer’s S-1 (or similar) registration. Both must be reviewed by the Securities and Exchange Commission (SEC). You can monitor new submissions on the SEC’s website under Self-Regulatory Organization (SRO) filings and company registrations. Pro tip: Check primary sources, not screenshots. Genuine filings appear on SEC SRO filings and EDGAR. If you don’t see them there, treat headlines as unverified. ETFs are wrappers, not adoption engines ETFs can improve access and liquidity, but they don’t create economic activity on a blockchain by themselves. For enterprise tokens like HBAR, sustainable demand typically stems from on-chain fees, staking participation, or services consumed by real users and developers. A wrapper may amplify existing interest; it rarely manufactures it from thin air. Where ETFs stand today and why altcoins face a higher bar Spot Bitcoin ETFs were approved in the U.S. in 2024, followed by spot Ethereum ETFs later that year. These decisions reflected years of market maturation: surveillance-sharing agreements, a deep and regulated futures market for the underlying, institutional custody, and clearer narratives around asset classification. Why Bitcoin and Ethereum were first Market depth: High liquidity across multiple venues helps price discovery and reduces manipulation risk. Infrastructure: Established custodians, audit practices, and benchmarks enable institutional-grade operations. Regulatory familiarity: Regulators and courts have engaged extensively with Bitcoin and Ethereum, building case law and review precedent. Why altcoin spot ETFs are harder Classification uncertainty: Many tokens face unresolved questions around whether they are securities under U.S. law, complicating ETF listing. Surveillance and integrity: Regulators weigh the risk of market manipulation and the robustness of spot-market oversight for the specific asset. Custody and staking: Proof-of-stake assets raise questions about whether funds can or should stake, and how rewards are handled for shareholders. Liquidity thresholds: Thin order books and concentrated exchanges increase tracking error and operational risk for a daily creations/redemptions vehicle. Jurisdictional nuance Outside the U.S., several European exchanges host crypto exchange-traded products (ETPs) beyond Bitcoin and Ethereum. These can provide a datapoint on investor appetite but often carry lower assets under management (AUM) and thinner liquidity than flagship BTC/ETH products. The presence of an ETP does not imply regulatory acceptance in other markets. Enterprise blockchain tokens 101: design choices and demand drivers “Enterprise blockchain” describes networks optimized for predictable performance, governance, and compliance features that large organizations find workable. Hedera is often included in this category due to its Governing Council model and the use of hashgraph consensus with stake-based weighting. What HBAR does on the network Transaction fees and services: HBAR is used to pay for services on the Hedera network—like token transfers, consensus messages, and smart contract calls. See Hedera’s documentation for current details on the token’s role and fee model: docs.hedera.com . Security and participation: The network uses a proof-of-stake design, and HBAR plays a role in network security and participation mechanics as defined by protocol rules. Incentives and grants: Ecosystem incentives can bootstrap usage, but they may also obscure organic demand if not time-limited and transparent. Why adoption may not equal price appreciation Fee abstraction: Some enterprise integrations hide token mechanics from end users or pre-fund activity via intermediaries, weakening direct, market-driven buy pressure for the token. Supply schedules: If a token’s emissions or unlocks outpace demand growth, price can stagnate despite rising usage. Hedera has a fixed maximum supply of 50 billion HBAR distributed over time per its published plan. Review current circulation and unlock calendars on reputable trackers such as CoinMarketCap alongside Hedera’s official materials. Governance trade-offs: Enterprise-friendly governance can aid adoption but raise decentralization concerns for crypto-native investors, which can affect valuation multiples. Where enterprise blockchains can shine Real-world assets (RWA): Tokenized funds, deposits, and commodities require predictable settlement, auditability, and policy controls. Sustainability data: Anchoring emissions and supply-chain attestations, with transparent, tamper-evident logs. Hedera’s ecosystem has tools aimed at this use case; explore its open-source resources via the official docs . High-frequency messaging: Corporate workflows and IoT events can use low-cost consensus messages for ordering and proof of existence. Would an ETF even help HBAR? Pathways and pitfalls An ETF could lower access frictions for institutions restricted to listed securities, potentially broadening the investor base. But for enterprise tokens, that tailwind must outweigh structural headwinds like supply overhangs, unclear U.S. classifications, and weaker spot-market surveillance. ETF readiness across crypto categories CategoryPlausibility of Spot ETF (US)Key Constraints BitcoinEstablishedOngoing surveillance and custody, but precedents exist. EthereumEstablishedStaking treatment, custody, and disclosures continue to evolve. Enterprise L1s (e.g., HBAR)UncertainAsset classification, liquidity depth, market integrity, and custody breadth. Interoperability/other L1sUncertainSimilar hurdles; limited regulated market structure. Privacy coinsUnlikelyEnhanced AML/market integrity concerns. StablecoinsStructural mismatchReserve management and money-market alternatives complicate design. Will ETFs stake PoS tokens? Even if a spot ETF for a proof-of-stake asset is approved, U.S. products have tended to avoid staking at launch due to regulatory and operational complexity. That means any on-chain yield may not accrue to shareholders, limiting the wrapper’s appeal compared to direct holding. ETP precedents elsewhere Some European issuers list single-asset crypto ETPs beyond BTC and ETH. These products show technical feasibility but have historically attracted modest flows compared to flagship assets. They are useful barometers: if a non-U.S. HBAR ETP existed and built meaningful AUM and secondary-market liquidity, it could strengthen the case for broader adoption—but it still wouldn’t guarantee U.S. approval. Metrics that matter: testing the comeback thesis If the “enterprise tokens comeback” is real, it should show up in data well before an ETF filing hits headlines. Focus on traction, not tweets. Utilization and revenue signals On-chain fee revenue (in fiat terms): Rising paid usage indicates real demand. Watch trends across services (token transfers, messages, smart contracts). Active accounts and cohort retention: New address creation paired with sustained activity is healthier than one-off spikes. Transaction composition: Growth in economically meaningful activity (e.g., asset transfers, contract calls) carries more weight than spammy micro-messages. Where to look: Hedera explorers such as HashScan , official dashboards, and independent analytics providers can help build a picture over time. Supply, unlocks, and liquidity Emission schedule: Validate circulating supply today and upcoming unlock tranches using official materials and neutral aggregators. Exchange depth and spreads: Check top venues’ order books. If a medium-sized order moves the market, ETF flows would struggle to track a fair price. Derivatives structure: Futures open interest and funding rates show how speculators are positioned; elevated leverage magnifies downside in pullbacks. Enterprise traction beyond press releases Proof of write: If a partnership claims on-chain logging, you should see associated transactions on the public ledger. From pilot to production: Look for language about volume commitments, SLAs, and migration timelines. Pilots rarely move tokens; production does. RWA indicators: Tokenized funds or assets using the network, with public contract addresses, custody arrangements, and verifiable settlement flows. How to position for the narrative without overexposing ETF rumor cycles can reward speed, but they punish complacency. If you choose to trade or invest around this theme, build defenses first. Define maxima: Cap position size relative to portfolio and to the asset’s 30–90 day realized volatility. Smaller caps need smaller bets. Stage entries: Use dollar-cost averaging and limit orders. Narrative spikes often retrace before any filings surface. Mind custody: If self-custody, test a small transfer first; if using an exchange, review its proof-of-reserves approach and jurisdiction. Beware leverage: Perpetuals can look cheap until funding flips. Size so that a 30–50% drawdown doesn’t trigger forced liquidations. Separate thesis buckets: Keep a “utility” bucket (longer-term, on-chain traction) distinct from a “wrapper” bucket (event-driven ETF angle). Manage them independently. Pro tip: Create alerts for new SEC 19b-4 and S-1 filings, on-chain fee milestones, and exchange depth changes. React to data, not social posts. Red flags and realistic timelines Spot ETFs beyond BTC and ETH face heavier scrutiny. Even with strong usage, timelines can be measured in quarters or years. Keep these red flags in view: Fake filings: Screenshots or “leaked” approvals that aren’t reflected on official portals. Thin-liquidity pumps: Rapid climbs on low volume, followed by steep reversals, often accompany unverified rumors. Unlock overhangs: Large upcoming distributions to foundations, early purchasers, or ecosystem funds can cap rallies if not absorbed by demand. Regulatory actions: New enforcement or policy shifts affecting token classification, staking, or exchange operations can alter the ETF calculus overnight. Disconnects between claims and chain: If “enterprise adoption” headlines don’t produce observable on-chain writes or contract interactions, adjust expectations. None of these are unique to HBAR; they apply to most non-BTC/ETH assets vying for mainstream wrappers. A comeback for enterprise tokens is most credible when underpinned by durable, paid usage and transparent governance—not when it’s carried by the hope of a ticker symbol on an exchange. For ongoing coverage of crypto market structure, tokenization, and enterprise blockchain adoption, you can follow analysis from Crypto Daily at cryptodaily.co.uk . Frequently Asked Questions Is there an HBAR spot ETF right now? No. As of publication, there is no approved HBAR spot ETF in major markets. Any mention of an “HBAR ETF” is speculative unless you can verify active regulatory filings and approvals on official portals. What would need to happen for an HBAR ETF to be approved? Regulators would need confidence in market integrity, surveillance-sharing, deep spot liquidity, robust institutional custody, and the asset’s regulatory classification. In the U.S., you would see a 19b-4 proposal and an S-1 registration filed and accepted before listing. Would an ETF guarantee higher HBAR prices? No. ETFs are distribution channels, not demand engines. Prices ultimately reflect supply, organic on-chain usage, investor flows, and broader risk conditions. Even assets with ETFs can fall during risk-off periods. Do enterprise blockchain use cases necessarily increase token demand? Not necessarily. If fees are abstracted, subsidized, or paid via intermediaries that pre-purchase tokens long in advance, near-term market demand can be muted. Transparent, usage-linked fee models tend to have stronger token-value connections. Could an ETF stake HBAR and pass through rewards? Historically, U.S. spot ETFs for proof-of-stake assets have launched without staking, citing regulatory and operational complexities. If staking were ever permitted, funds would need clear policies on reward treatment and risk management. How can I track whether the enterprise-token comeback is real? Watch on-chain fee revenue in fiat terms, active accounts with repeat activity, contract call growth, visible production deployments, and secondary-market liquidity. Cross-check against unlock schedules and exchange depth. Where can I learn more about HBAR’s token mechanics? Review Hedera’s official documentation at docs.hedera.com and compare circulating supply data on neutral aggregators such as CoinMarketCap . Always verify details against primary sources. Disclaimer: This article is provided for informational purposes only. It is not offered or intended to be used as legal, tax, investment, financial, or other advice.
22 May 2026, 07:34
RENDER vs AKT: Which AI Compute Token Has the Stronger Case?
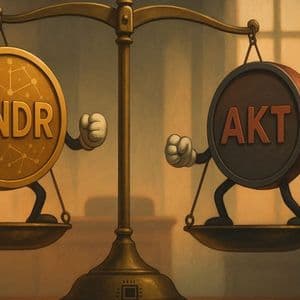
AI models are hungry for compute, and centralized clouds can be pricey, rationed, or closed to smaller teams. That gap has propelled a new class of crypto networks that coordinate GPUs and CPUs in open marketplaces. Two standouts at the center of this trend are Render (RNDR) and Akash Network (AKT). Both promise permissionless access to compute and a way for hardware owners to monetize idle capacity. Yet they approach the market from different angles, with distinct architectures, pricing models, and token incentives. This side-by-side analysis looks at how RNDR and AKT work, where they shine, how they price resources, the risks to consider, and what could matter most for builders and token holders. It is not financial advice. PointDetailsFocusRender zeroes in on GPU-heavy rendering and AI inference; Akash is a general-purpose decentralized cloud with growing GPU support.ArchitectureRender operates on Solana with a job marketplace; Akash is a Cosmos SDK chain with a lease-based compute market via on-chain orders.PricingRender emphasizes task quotes and reputation-driven rates; Akash uses a bid/ask marketplace that tends toward a clearing price for leases.Token RoleRNDR is used to pay for completed jobs and reward providers; AKT secures the network via staking, governs parameters, and settles leases.Best FitRender suits creative rendering, 3D pipelines, and GPU inference workflows; Akash suits containerized web services, APIs, and training/inference experiments.Key RisksWorkload verification, job failure, token volatility, chain congestion, regulatory uncertainty, and provider reliability on both networks. The AI compute bottleneck these tokens try to solve As models grow and experiments multiply, compute procurement has turned into a bottleneck. Major clouds gate GPUs during demand spikes, early-stage teams struggle with credit limits, and running a fleet of on-prem cards is operationally heavy. Decentralized compute networks aim to invert that model. Anyone can supply hardware, users can permissionlessly request resources, and pricing can be discovered in a market rather than set by a single provider. Tokens coordinate incentives, payments, and—where applicable—security. Render and Akash occupy different layers of that vision. Render started with distributed GPU rendering and has expanded toward AI workloads. Akash began as a decentralized alternative to cloud providers and has added a permissionless GPU marketplace for AI. Both are worth watching as AI demand collides with crypto’s open-market design. Under the hood: How each network allocates compute Render’s job-first pipeline Render is built around a task marketplace for GPU jobs. Creators submit rendering or inference tasks, specify quality and budget parameters, and source capacity from independent node operators. Payments and reputation flow through the RNDR token on Solana. The network leans on mechanisms such as reputation, job redundancy, and partial result validation to keep outputs reliable. Integrations with existing creative tools help match specialized workloads to suitable GPUs. Put simply: Render brokers specialized GPU work from creators to operators and pays for verified results in RNDR. Akash’s lease-based cloud market Akash is a Cosmos-based chain that matches buyers and sellers of compute through on-chain orders. Users define containerized workloads (e.g., Docker images) with resource requirements and a max price. Providers advertise inventory and minimum acceptable rates. The network negotiates a lease at the market-clearing price, and workloads run on the chosen provider’s infrastructure. Payments are streamed in AKT over the life of the lease, with governance and staking aligning validators and network parameters. In short: Akash offers a decentralized cloud where containers (including GPU jobs) run on providers who win leases via market pricing. RNDR vs AKT: Token design and incentives RNDR: Payment unit for verified results RNDR functions primarily as the medium of exchange between job requesters and node operators. Users fund tasks in RNDR; operators earn RNDR upon successful completion and verification. The network’s reputation and job-checking logic are critical because they tie directly to token flows: the more reliable the output, the more predictable the earnings and the better the user experience. Render’s migration to Solana—approved via community governance—positions it to benefit from faster finality and lower fees. That matters when splitting payments across many micro-tasks or distributing rewards to numerous nodes. Token holders also care about how economic policies (such as job pricing rules or fee mechanisms) evolve under governance, as these affect long-term utility and demand for RNDR. For current details, consult the foundation’s documentation and governance pages on the official site ( Render Network and docs ). AKT: Security, governance, and settlement AKT secures the Akash chain through staking and supports on-chain governance for parameters like marketplace rules and incentives. Leases for compute settle in AKT, providing native demand when workloads run on the network. Stakers and validators have skin in the game via potential slashing if they misbehave at the consensus layer. Token holders should be aware of staking rewards and inflation dynamics as set by governance; these can change over time. For authoritative specifications, refer to the Akash official site and documentation ( Akash Network and docs ). Why it matters: RNDR’s value proposition revolves around throughput and verified job output. AKT’s value proposition is tied to the security and liquidity of a live marketplace for generic compute. Both derive token demand from real usage, but through different mechanisms. Pricing, performance, and workload fit Choosing between RNDR and AKT often comes down to workload characteristics, tolerance for setup complexity, and how you prefer to price risk. Pricing dynamics Render: Requesters typically submit jobs with desired parameters and budget ranges. Operator reputation, hardware quality, and current demand influence quotes. For rendering or specific inference pipelines, this quote-driven model can be efficient, especially when you can benchmark time-to-completion against previous runs. Akash: Buyers post a bid (max price) for a given container spec while providers post asks. The network pairs them at a market-clearing rate for a lease period. This can lead to competitive pricing for persistent services (APIs, microservices) and batch jobs when providers compete on cost. Performance considerations Render: Optimized for GPU tasks, with an ecosystem rooted in media, design, and now AI inference. Expect workflows tuned for high-throughput render frames and batch inference outputs. Verification and partial-redundancy strategies help ensure quality. Akash: General-purpose containers mean you can run web stacks, databases (with care), model training, inference servers, or orchestration layers. Performance will vary by provider hardware, network connectivity, and how well your container is optimized. Where each excels Pick Render when you need specialized GPU rendering, 3D/VR content pipelines, or clearly defined inference jobs where per-task validation is straightforward. Pick Akash when you want to deploy and iterate with containerized services, build a pipeline end-to-end (data prep to inference), or negotiate persistent leases for APIs and apps. FactorRender (RNDR)Akash (AKT)Primary WorkloadsGPU rendering, AI inference batchesGeneral cloud workloads, training/inference, APIsMarket MechanismTask quotes and operator reputationBid/ask marketplace and leasesSettlement LayerSolanaCosmos SDK chainOnboarding CurveCreator-oriented tools and portalsDevOps-friendly (CLI, container specs)Verification ModelRedundancy, reputation, output checksProvider audits/attributes, lease enforcement, monitoringBest ForSpecialized GPU tasks with predictable outputsFlexible, containerized compute with competitive pricing Pro tip: Run a small benchmark on both networks for your exact workload. A single test job can reveal more about price/performance than generic comparisons. Onboarding and workflow: What builders actually touch Render: Creator-first Render’s roots are in the creative industry. Expect a user experience tailored to artists, studios, and builders focused on visual outputs and GPU kernels. Job submission surfaces key quality toggles and budget constraints, and operators are discoverable via marketplace tools. If your team already uses 3D or visual effects pipelines, Render’s integrations can feel familiar and lower the switching cost. Akash: DevOps-native Akash expects you to describe deployments in a declarative spec and interact through a CLI or compatible tooling. If your team already works with containers and infrastructure-as-code, the learning curve is manageable. The payoff is flexibility: you can re-use the same container you would deploy on a traditional cloud, then iterate on provider selection and price until you hit the target service level. Good fit for: backend engineers, MLOps teams, and anyone comfortable with Docker, CI/CD, and YAML-based specs. Extra work: you may need to handle observability, failover, and secrets management as you would on any cloud. Security, verification, and reliability trade-offs Decentralized compute adds a new trust model: the network matches you with unknown providers. Both Render and Akash include controls to make this workable, but users should plan for failure modes. Workload verification: Render leans on reputation, redundancy, and output checking to pay only for valid results. For deterministic renders and inference outputs, this works well. For novel or non-deterministic jobs, verification can be trickier. Provider assurances: Akash providers can publish attributes (e.g., audits or identity attestations) so tenants choose who they trust. Monitoring, restart policies, and multi-provider strategies help keep services up. Chain dependencies: Render relies on Solana finality and liveness; Akash relies on its Cosmos-based consensus and IBC links. Congestion or outages on the base layer can impact settlement or orchestration. Payments and escrow: Both networks aim to pay for results or ongoing service, not promises. That reduces counterparty risk, but doesn’t remove it entirely. Operational checklist: Split large jobs into smaller tasks to limit rework if a provider fails. Use redundancy or re-run thresholds for critical outputs. Benchmark providers and keep a shortlist of reliable operators. Automate alerts and budget limits to avoid runaway spend. Regulatory and economic risks to keep in view Tokens tied to real-world utility still carry crypto-native risks: Volatility: RNDR and AKT can swing in price. If you fund jobs in volatile tokens, your cost basis can change during long runs. Consider hedging or topping up gradually. Governance changes: Economic parameters (fees, rewards, marketplace rules) evolve via governance. Follow proposals on the respective forums and docs. Regulatory landscape: Token classification and marketplace rules differ by jurisdiction and can change. Teams should consult counsel for commercial deployments. Smart contract and protocol risk: Bugs, misconfigurations, or chain-level issues can disrupt operations. Review architecture diagrams and incident reports on official sites. Scams and impersonation: Only use official links and verified marketplaces. Cross-check token contract details on reputable aggregators like CoinMarketCap (RNDR) and CoinMarketCap (AKT) . So, which token has the stronger case for AI compute? It depends on what you’re optimizing for. If your core workloads are GPU-heavy rendering or structured inference batches and you value a creator-oriented workflow and verification tuned to predictable outputs, Render makes a compelling case. Its focus and integrations may translate to better turnaround and fewer surprises for these tasks. If you need a flexible, containerized environment for APIs, data processing, training experiments, or multi-stage ML pipelines—and you’re comfortable with DevOps—Akash’s lease market and Cosmos-first design make it a strong pick. Price discovery can be particularly attractive when providers compete. For investors evaluating token exposure rather than running workloads, the calculus shifts: RNDR demand is more directly tied to completed job volume and network adoption in rendering/inference niches. Watch metrics like active node operators, job throughput, and integrations listed on the official site. AKT demand reflects both marketplace activity (leases, providers, GPU capacity) and chain security/governance dynamics. Track on-chain leases, provider growth, and staking participation on official explorers and dashboards linked from akash.network . There is room for both to succeed: RNDR specializing in high-value GPU tasks with strong verification and creator UX; AKT generalizing to a broader cloud with competitive pricing and flexible deployments. The “winner” for your team or thesis is whichever aligns with your workload profile and risk tolerance. For continuing coverage of decentralized compute, network upgrades, and market data, Crypto Daily tracks these ecosystems and the broader AI x Web3 intersection at cryptodaily.co.uk . Frequently Asked Questions Are RNDR and AKT direct competitors? They overlap in AI-related GPU demand but approach the market differently. Render is optimized for specialized GPU jobs (rendering and inference). Akash is a general-purpose decentralized cloud with containers and leases, now including GPUs. Many teams could reasonably use both at different stages of a pipeline. Which is cheaper for AI inference or training? It varies by timing, hardware, and job shape. Render often shines for batch GPU jobs with clear verification, while Akash’s bid/ask market can deliver sharp prices for persistent services or flexible experiments. The only reliable answer is to benchmark your exact workload on both. Can I earn by supplying hardware? Yes. On Render, you can operate a node to process jobs and earn RNDR upon verification. On Akash, you can register as a provider and lease compute to tenants for AKT. Review the latest operator requirements and security practices on the official docs before committing hardware. Do these networks support AI model training? Akash’s container-based approach can support training runs if suitable GPUs and memory are available from providers. Render is geared toward rendering and inference jobs; training support depends on provider setups and network tooling. Always confirm resource specs before launching large runs. How do I manage reliability on decentralized providers? Break big jobs into chunks, use redundancy or checkpoints, monitor performance, and maintain fallback providers. On Akash, deploy across multiple providers. On Render, leverage reputation and re-run strategies. Design for failure the way you would on any large-scale cloud. What are the main token risks for holders? Price volatility, potential changes in token economics via governance, and adoption risk if demand for compute doesn’t materialize as expected. There is also regulatory uncertainty in some jurisdictions. None of this is financial advice; do your own research. Where can I find authoritative updates? For Render, start with the official site and documentation: rendernetwork.com and docs.rendernetwork.com . For Akash, use akash.network and docs.akash.network . For token listings and contract references, cross-check aggregators like CoinMarketCap or CoinGecko . Disclaimer: This article is provided for informational purposes only. It is not offered or intended to be used as legal, tax, investment, financial, or other advice.


