


 Invest ideas
News
21 May 2026, 17:47
Elon Musk Grok AI Predicts GOLD Price by End of 2026

Gold price just ran from $3,300 to $5,400 in under a year and most people still think of it as the boring safe haven asset. Grok AI looked at that chart and predicts the move is not finished. Not even close. $5,500 to $6,300 per ounce by end-2026. Another major leg higher from a price that has already broken every historical record. Grok’s bull case is not built on fear alone. It is built on a structural demand shift that central banks have been executing quietly for years. Over 800 tonnes of gold are being purchased annually by central banks, a pace that has not slowed despite prices hitting all-time highs repeatedly. Source: Grok AI GOLD Price Prediction That is not speculative buying. That is sovereign wealth allocation at scale, driven by de-dollarization flows that show no signs of reversing. Layer geopolitical risks, record global debt levels, and fiscal uncertainties on top of that institutional bid and you have a demand profile that is compounding rather than plateauing. Emerging market ETF inflows are adding retail and institutional demand from economies that historically underowned gold. And constrained mine supply means the production side cannot respond to higher prices the way it normally would, which tightens the float further as demand accelerates. Grok’s framing is precise: gold has already made the move from $3,300 to $4,500 on these same tailwinds, and the second leg toward $6,300 is the continuation of a multi-year trend rather than a new prediction. The bear case requires 3 things to go wrong simultaneously. Inflation falling sharply removes the safe-haven urgency. The dollar strengthening materially redirects global capital flows. And central bank purchases slowing breaks the institutional demand floor. Grok acknowledges those risks but is direct: even in that scenario the broader reallocation trend keeps downside well-supported and the bullish bias intact. The bear case is consolidation toward $4,000 to $4,400, not a trend reversal. Tether Gold (XAUT) 24h 7d 30d 1y All time Discover: The best crypto to diversify your portfolio with Gold Ran 65% in 12 Months and Is Now Pulling Back, Grok AI Predicts This Is a Reset Before the Next Leg, Not the Top Gold spot price is trading at $4,510 on the daily, and the chart is one of the most impressive trend structures in any asset class over the past 14 months. Price ground sideways between $3,000 and $3,400 for most of 2024 and early 2025, then broke out in September 2025 in a near-vertical move that took it all the way to $5,600 by February 2026. That was a 65% move in 5 months driven by exactly the forces Grok identified in its prediction. The current pullback from $5,600 to $4,510 is the first meaningful correction since that breakout began, and the chart is now testing a critical support zone. The $4,400 to $4,600 range is where the late 2025 consolidation occurred before the final push to $5,600, which means it is the most logical area for buyers to step in and defend the trend. Grok’s bear case floor of $4,000 to $4,400 sits just below that zone, and whether that support holds or breaks determines whether this is a bull flag reset or a more serious correction. Resistance above is $4,800 to $4,900, the range where multiple rejections clustered during the March and April consolidation phase. Above that $5,200 is the next reference and $5,600 is the February peak that needs to be cleared before Grok’s $5,500 to $6,300 target zone becomes the chart reality rather than just the prediction. Grok sees $6,300 by year-end. The chart needs $4,400 to hold first. Discover: The best pre-launch token sales The post Elon Musk Grok AI Predicts GOLD Price by End of 2026 appeared first on Cryptonews .
21 May 2026, 17:30
Mark Cuban says he sold most of his Bitcoin after failed hedge narrative 'disappointed' the billionaire

The billionaire investor said he sold most of his bitcoin after concluding the cryptocurrency failed to act as a hedge during recent geopolitical turmoil and dollar weakness.
21 May 2026, 17:30
Chainlink Sees Historic On-Chain Surge While Exchange Supply Keeps Shrinking – Details

Chainlink has lost the $10 mark as the market faces a retrace that could extend further. Leaving holders navigate a price structure that offers little immediate comfort. The decline is real — but a CryptoOnchain report has identified a development in the network data from earlier this month that reframes what the current price weakness is actually occurring against. Related Reading: HYPE Accumulation Intensifies As Whale-Linked Position Surpasses $100M Between May 9 and 10, Chainlink’s active address count spiked to over 280,000. A figure that requires context to feel as alarming as it is. The network’s historical baseline sits at approximately 3,000 daily active addresses. The spike represents a 93-fold increase from that baseline, compressed into a two-day window, with no precedent in Chainlink’s recent on-chain history. Something significant moved through the network at a scale that dwarfs routine activity by nearly two orders of magnitude. In traditional on-chain analysis, a spike of that magnitude triggers an immediate assumption: retail panic, large token movements toward exchanges, and preparation for liquidation. The historical pattern for anomalies of this scale is distribution. Big holders and retail participants are rushing toward the exit simultaneously. Creating the kind of exchange inflow pressure that translates directly into selling pressure on the price. That assumption does not hold here. The CryptoOnchain report cross-references the network surge with exchange flow data — and what it finds is the opposite of what the conventional framework would predict. Exploding Network Activity Alongside Shrinking Exchange Supply The CryptoOnchain analysis turns to Binance flow data to resolve the contradiction the network spike created — and what it finds dismantles the sell-off interpretation entirely. Despite the most extreme active address anomaly in Chainlink’s recent history, Binance’s LINK reserve has been declining steadily for the past 14 days, falling from 86.3 million to 85.8 million tokens. The 7-day average netflow remains heavily negative, with outflows consistently outpacing inflows throughout the entire period. Chainlink Structural Divergence | Source: CryptoQuant The timing is the detail that matters most. Market participants were actively withdrawing LINK from Binance at precisely the moment the network was experiencing its most intense activity. If the 280,000 active address spike represented panic selling or distribution, the exchange flow data would show the opposite — coins moving onto exchanges rather than away from them. The data shows coins leaving. That divergence between network intensity and exchange behavior points toward a structural interpretation rather than a sentiment one. Tokens migrating toward self-custody or being locked in smart contracts — potentially connected to CCIP adoption and the expanding use of Chainlink’s cross-chain infrastructure — would produce exactly this signature: explosive on-chain movement alongside declining exchange reserves and persistently negative netflow. The supply implication follows directly. LINK leaving exchanges and entering self-custody or smart contract lock-up reduces the liquid float available for immediate sale. That reduction, occurring alongside genuine network utility growth rather than speculative activity, creates the kind of supply tightness that historically precedes structural price appreciation — not immediately, but as the available sell-side inventory shrinks against whatever demand arrives next. Related Reading: XRP’s Big Buyers Returned In April But Left In May: Capital Inflows Data Explains The Shift Chainlink Struggles Below Key Resistance: Bulls Defend Critical Support Chainlink continues to trade under pressure after losing the psychological $10 level, with the daily chart showing a market still trapped inside a broader bearish structure despite signs of stabilization. LINK is currently trading near $9.60 after rejecting sharply from the recent local high around $10.70, where sellers stepped in aggressively and prevented a breakout above the descending resistance zone that has capped price action since January. Chainlink consolidates below key level | Source: LINKUSDT chart on TradingView The chart shows LINK consolidating between roughly $8.80 and $10.00 for several weeks, forming a tightening range just above the 200-day moving average. That level near $9.20 is becoming increasingly important because it has acted as dynamic support throughout May. Bulls have repeatedly defended the area, preventing a deeper retracement back toward the February lows near $7.50. Related Reading: Bitcoin’s 2026 Market Structure Reveals A Problem Hidden Beneath ETF Growth At the same time, the 200-day exponential moving average continues trending downward above the current price, reinforcing the idea that the broader macro trend remains fragile despite the recent recovery attempt. Volume has also cooled notably compared to the capitulation phase seen in February, suggesting that the latest decline reflects exhaustion and consolidation rather than panic-driven selling. For bulls, reclaiming the $10.00–$10.70 region remains essential to shift momentum decisively back in favor of buyers. Featured image from ChatGPT, chart from TradingView.com
21 May 2026, 17:24
US Government Makes $2 Billion Bet on Quantum Computing as Threat to Bitcoin Grows

The U.S. Department of Commerce will invest $2 billion into quantum chip foundries and startups as the "Q-Day" Bitcoin threat nears.
21 May 2026, 17:23
HYPE Explodes to New All-Time High as Hyperliquid ETF Demand Crushes Supply Pressure

Hyperliquid has seen a notably fierce rally with the token up almost 20% in one day and trading at an all-time high of $62.10. This jump comes as Hyperliquid-linked exchange-traded funds (ETFs) recorded US$25.5 million in net buying on Wednesday alone, indicating strong institutional interest for the fast-growing ecosystem. As of press time, HYPE stood at just under $61 after a daily gain of more than 15%. The token has gained more than 100% year-to-date, making it one of the best performing digital assets YTD in this market cycle. Since institutional accumulation is currently occurring just as fast, it highlights the importance of the rally. The most recent ETF inflows exceeded the sum of all previous five trading days, when combined showed total influx $22.35 million. That rapid pace of growth has propelled market confidence and fueled expectations that Hyperliquid could play a pivotal role in the future financial infrastructure of crypto. HYPE Jumps 15% as Hyperliquid ETFs Pull $25.5M in a Single Day @HyperliquidX ETFs logged $25.5M in net buying on Wednesday – more than the combined inflows of their first five days ($22.35M). HYPE rallied to an intraday high of $58.97 (currently $57.20), up 15.3% on the day and… pic.twitter.com/Hd8n2MBv6I — Top 7 Crypto | Analytics & Alpha (@top7ico) May 21, 2026 HYPE In Price Discovery As ETF Demand Hyperliquid’s price momentum isn’t only a retail driven speculation-driven phenomenon. Analysts are drawing increasing parallels between the sharp price jump and the ongoing explosion in ETF-led buying. In a post from crypto tracking accounts, Hyperliquid ETFs attracted $25.5 million in organic single-session net inflows (Purchase YOY inflows). That is about 17 times greater than HYPE’s daily burn rate of around $1.4 million, at a maximum Attitude Fund per day. The Assistance Fund operates as a liquidity-tightening instrument, slowly withdrawing tokens from circulation. Still, institutional buying pressure dwarfs that deflationary dynamic now. The imbalance of a declining supply, and rapidly increasing demand, is ripe for a breakout rally. With forward momentum moving through the crypto markets, traders continue using capital to transition into HYPE. Market observers note the token continues demonstrating dull price performance in spite of recent surge, some believe its fair value is above current status. One of the loudest is Matt Hougan rejecting the misinterpretation that still many investors have on Hyperliquid’s role. Many traders still see HYPE as just a governance token for a perpetual decentralized exchange, and this is something Hougan mentioned recently. According to him, the market does not take into account Hyperliquid’s new position that resembles more and more the one of large financial infrastructures like Robinhood or CME Group. This comparison is being made as Hyperliquid broadens its horizon outside the domain of traditional functionality for decentralized trading. Accumulation of Whales Strengthens Bullish Momentum It is not just institutional inflows moving the price of HYPE up, however. On-chain data suggests large whale accumulation over the last few days. While prices kept rising in slow-motion through the whole month large wallets have discreetly accumulated tens of millions of dollars worth tokens. Such aggressive buying shows that institutional buyers expect further upsides. Over a two-hour period, one wallet associated with what appeared to have been Galaxy Digital purchased 158,100 HYPE, worth about $8.8 million at the time. Named 0xBED9, the movement this wallet has made is just another part of illegal proof that instead sophisticated whales choose to heavily position in the Hyperliquid ecosystem. At the same time, a new wallet with interface value of 0x4CBB emptied out over two days 536,247 HYPE from Coinbase. Those tokens would be worth close to $29.87 million. Whale activity alone now totals over $38 million and comes at the same time as one of HYPE’s best weeks on record since launch. In the past week, the token has risen by over 50%, reaching its previous all-time high of $59.30 on September 18, 2025 and continuing to break through it. Bitwise Announces More Commitment to Hyperliquid The confidence in Hyperliquid from institutions was further demonstrated after Bitwise Asset Management publicly revealed the wallet addresses associated with its ETF holdings. The company stated that it has built a position of approximately $19.78 million worth of HYPE and staked all of it, showing trust in the future potential for HYPE. These disclosed holdings show on paper a gain of about $2.4 million of unrealized gains with HYPE near record highs This also signals increasing confidence in Hyperliquid’s economic model from institutions, as Bitwise has decided to stake the tokens out entirely. In contrast to just holding passive exposure, Bitwise also engages in network functionality while securing staking rewards. If HYPE-related products maintain their upward trend, then that could convince other institutional investors to adopt this strategy. ETF driven demand combined with aggressive staking and other mechanisms in the coming weeks could drive circulating supply into an even deeper corner, crypto analysts note. Bitwise Stakes $19.78M in $HYPE with $2.4M Profit on Paper. Bitwise Asset Management has released its ETF wallet addresses, revealing continued accumulation of Hyperliquid (HYPE). So far, the firm has acquired around $19.78 million worth of HYPE and has staked the full… pic.twitter.com/3J0VAmgQRE — TheCryptoBasic (@thecryptobasic) May 21, 2026 Hyperliquid Overtakes Solana in FDV Hyperliquid also passed Solana in FDV, topped by another milestone. Hyperliquid is recently reported to have an FDV of $54.57b, putting it just ahead of Solana at $54.21b. This is an amazing addition to the protocol, particularly when we consider that Solana may be one of the most mature ecosystems we have in terms of blockchain. More than that, Crossing Solana in FDV ignited heated discussions across the digital asset industry. The shift in valuation leads some investors to read it as the market progressively prioritizing trading infrastructure and decentralized financial rails over a Layer-1 blockchain narrative. Some are more cautious, saying lower momentum could threaten a further sharp rise in valuations and increased volatility. Still, the price action now points to buyers still having an upper hand. Trading volumes continue to grow, wallets owned by whales keep piling up and ETF inflows show no signs of slowing. Market Looks Ahead to Next Major Breakout The attention around Hyperliquid has now positioned HYPE to be one of the most followed tokens in all of crypto Investment accumulation, ETF demand, staking behavior and whale activity has created one of the strongest bullish setups seen in the crypto asset. Some analysts expect price corrections over the short term after such a limited rally, but many traders are still chasing higher prices, so confidence in the Hyperliquid infrastructure narrative is growing. Market watchers would expect HYPE to find its way into another aggressive price discovery phase with the current pace of ETF inflows. Disclosure: This is not trading or investment advice. Always do your research before buying any cryptocurrency or investing in any services. Follow us on Twitter @nulltxnews to stay updated with the latest Crypto, NFT, AI, Cybersecurity, Distributed Computing, and Metaverse news !
21 May 2026, 17:21
Bitcoin Bulls Lose Control After $78,000 Rejection Wipes out Overnight Recovery
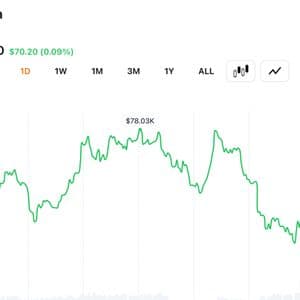
Bitcoin has erased its recent gains, failing to hold the $78,000 threshold and dropping to just above $77,000. Bitcoin Erases Gains as ETF Outflows Mount Bitcoin endured yet another underwhelming session, failing to hold the $78,000 mark and erasing earlier gains to close the 24 hours just above $77,000. The price action reversed the momentum


