


 Invest ideas
News
8 Jun 2026, 14:08
Solana whale returns to $26M as market downturn eats into 5-year, $337M position

A Solana staking whale, monitored by Arkham Intelligence under the entity name ‘SOL Staking Whale’, has lost most of the profits it made in a span of 5 years in the recent market crash. At the start, the whale invested about $26 million in assets. The total amount spiked to $337 million over 5 years. However, the whale profit and accumulation have tanked to about $26 million in the current market geopolitical drama. Throughout the trade journey, the whale has withdrawn SOL worth $137.67M from market gains. SOL whale loses millions amid market downturns As reported by Arkham Intelligence , the whale currently holds a total of 399,327 SOL worth around $26.46 million at present. According to Arkham’s breakdown shared on Monday, the whale took its first position when the price of the token was at a very different level compared to today. With the surge of the SOL token, driven by massive adoption of Solana in decentralized finance , NFTs, and meme coins, the position jumped 12X. SOL staking curated process by the trader. Source: Arkham via X/Twitter Instead of taking out all their positions in one go, the whale sold the shares from time to time, earning almost $137 million via gradual trading on Kraken and Binance. The trader’s present-day position stands at 399,327 SOL worth nearly $26.45 million, given the current exchange rate of around $66 per SOL. Small stakes in lesser tokens such as AISM, OZA, and other tokens bring only minimal value to the total. The approach used by the whale in staking the tokens while extracting some gains helped them de-risk the initial $26 million investment. The on-chain data tells a steady flow-out tale: about $23 million worth of SOL has been sent to exchange deposit addresses within the last four months. This is along with bulk transfers ranging from 50,000 to 120,000 SOL, shifting from staking to exchanges. $84M SOL whale transfer to Coinbase affects markets Another anonymous wallet moved 1,350,000 SOL, worth roughly $84,06 million, to Coinbase Institutional. The action, detected through on-chain tracking, comes at a time when Solana is experiencing weak prices. At the time of writing, the price of Solana was $66.09, struggling to maintain the psychologically important support level of $66. Solanas price in current marlket. Source: CoinMarketCap The exchange flow numbers further support the increased supply narrative. According to CoinGlass, the spot flows were $48.32 million and $38.76 million for inflows and outflows, respectively, resulting in a net flow of $9.56 million. However, even with this additional supply, some purchases were made by tokens that were being delivered into the network, thereby averting any sudden crash. Futures traders have also added their positions despite weak prices. The open interest on futures was up 7.87% to $4.50 billion, indicating new money flowing into futures markets and volatility expectations ahead. ETF outflows and the lingering bearish sentiment Institutional demand is displaying weakness. The fund saw net redemptions of $6.52 million last week, ending a four-week rally, a trend flagged by SoSoValue, which raised fears that continued outflows could add to downward pressure on the asset. Funding rate data supported the bearish outlook. The funding rate for Solana dipped into negative territory, reaching its lowest point since late February. The funding rate is -0.0192% (shorts pay longs) at the time of writing. The long/short ratio is noted at 0.95. As reported by Cryptopolitan , analysts still hold positive views of Solana following the recent drop. In 2026, they believe that the coin will cost no less than $55.65 on average, $139.73, and as high as $217.03. In 2029, its price can increase further, reaching an average of $419.60, up from $307.31. Finally, in 2032, its price may be from $351.97 on average to $580.21 and up to $808.45. If you're reading this, you’re already ahead. Stay there with our newsletter .
8 Jun 2026, 14:02
Pundit: Michael Saylor Just Flipped, XRP Holders You’d Better Watch This

Levi Rietveld, creator of Crypto Crusaders and a prominent XRP enthusiast, is watching two major catalysts reverse simultaneously. He highlighted these in a recent video and believes XRP holders should pay attention. On May 26, Michael Saylor announced his first Bitcoin sale, and markets reacted immediately. Multiple consecutive red days followed, with prices hitting lower lows and lower highs on the daily chart. Then, on June 2, Iran announced no peace deal with the U.S. and launched drone strikes, pushing prices even lower . Now, both of those catalysts are flipping. BREAKING: Michael Saylor Just FLIPPED | $XRP Holders You BETTER Watch This! pic.twitter.com/ALDLdSGOSl — Levi | Crypto Crusaders (@LeviRietveld) June 7, 2026 Michael Saylor Signals a Buy Saylor recently hinted at purchasing more Bitcoin, stating it is “a good time to add more dots.” Strategy, formerly known as MicroStrategy, has operated as a consistent Bitcoin accumulator since adopting its Bitcoin treasury strategy in 2020. The company has set a target of holding 1 million BTC by the end of 2026 , which would give it control of nearly 5% of Bitcoin’s total supply. Rietveld sees this buy signal as a direct reversal of the sentiment that weighed on markets over the past week and a half. Saylor selling Bitcoin and Iran rejecting peace talks hurt the markets. The opposite of both, happening at the same time, points toward potential short-term upside. Iran Peace Talks Resume Iranian Foreign Minister Abbas Araghchi is currently meeting with Pakistani envoys in Tehran for peace talks with the U.S. Rietveld notes that throughout the current Iran-US conflict , both sides have repeatedly shifted positions. He says this pattern has made market moves predictable and tradeable each time it has happened. He expects this instance to follow the same pattern. What the Charts Show On shorter-term timeframes, price action has already started to turn green after the recent decline . Rietveld notes that XRP’s price is approaching a top resistance line quickly. That compression near resistance, aligning the reversal of both catalysts, signals a potential short-term rally coming next week. He is not calling a major trend change. The focus here is on near-term price behavior tied directly to two specific, identifiable events now moving in a favorable direction. What This Means for XRP The combination of Saylor returning to a buying stance and diplomatic movement on the Iran-U.S. front gives the market two reasons to shift sentiment in the near term. Rietveld believes both catalysts are now pointed in the right direction, and the charts are beginning to reflect that. XRP holders who have been waiting on the sidelines now have a clearer picture of what drove the recent downside, and what could drive the next move up . Disclaimer : This content is meant to inform and should not be considered financial advice. The views expressed in this article may include the author’s personal opinions and do not represent Times Tabloid’s opinion. Readers are advised to conduct thorough research before making any investment decisions. Any action taken by the reader is strictly at their own risk. Times Tabloid is not responsible for any financial losses. Follow us on X , Facebook , Telegram , and Google News The post Pundit: Michael Saylor Just Flipped, XRP Holders You’d Better Watch This appeared first on Times Tabloid .
8 Jun 2026, 14:00
MicroStrategy’s BTC stash hits 845,256 after $101 million buy! What is the next move investors are watching?

🚨 1,550 BTC snapped up by Strategy brings the total to a jaw-dropping 845,256 BTC stash. 💼 The latest $101 million buy came after a sharp market pullback, with an average purchase price below company norms. 🪙 Investors in $BTC are closely watching how this impacts confidence and triggers moves by other institutions. Continue Reading: MicroStrategy’s BTC stash hits 845,256 after $101 million buy! What is the next move investors are watching? The post MicroStrategy’s BTC stash hits 845,256 after $101 million buy! What is the next move investors are watching? appeared first on COINTURK NEWS .
8 Jun 2026, 13:59
Whale's Insight: Bitcoin's Liquidity Trap: Will ETF Outflows And SpaceX IPO Push BTC Lower?

Summary Crypto decoupled to the downside as heavy ETF outflows and Strategy’s first disclosed BTC sale since 2022 hit market confidence. With U.S. equities at record highs and the SpaceX listing likely to draw liquidity, BTC still lacks a clear near-term rebound catalyst. Fresh buying power is missing while spot selling pressure remains heavy. Stablecoin exchange reserves are not building, and BTC exchange netflow points to more coins moving onto exchanges. Leverage was hit, but not cleared. Longs accounted for roughly 90% of the $1.76 billion in crypto liquidations on June 2, yet BTC-denominated open interest climbed to a record high around 784K BTC the next day. Crypto is breaking lower while U.S. equities are pushing to record highs. ETF outflows, weak stablecoin liquidity, and heavy long liquidations all point to the same problem: capital is leaving crypto just as SpaceX’s record IPO may draw even more attention away from risk assets. Will BTC keep grinding lower? Crypto’s Downside Decoupling from Equities The crypto market fell sharply this week. Bitcoin ( BTC-USD ) dropped more than 12% over 7 days, falling from above $70,000 to an intraweek low near $61,500. Total crypto market cap dropped to about $2.18 trillion on June 4, approaching the February lows and down roughly 48% from last year’s peak above $4.2 trillion. The contrast with traditional markets was stark. U.S. equities pushed to fresh record highs, led by AI names, while crypto and its listed proxies fell hard. Why Crypto Is Decoupling from Equities Equities are absorbing external pressure and still rising on AI strength, while crypto is being hit by both the same external drag and a simultaneous unwind of its own demand structure. Crypto-internal: ETF outflows: U.S. spot Bitcoin ETFs recorded 13 straight sessions of net outflows from May 15 to June 3, shedding $4.33 billion, the longest streak since the products launched in 2024 and a sharp reversal from April’s $1.97 billion of inflows. This weakened the structural demand engine of the 2025 rally. Strategy’s ( MSTR ) first disclosed BTC sale since 2022, totaling 32 BTC, was economically trivial but broke the multi-year “never sell” narrative that anchored institutional psychology. Mt. Gox moved 10,422 BTC , worth roughly $739 million, ahead of its October repayment deadline, reviving supply-overhang fears. External, shared with all risk markets: Sticky inflation: April CPI hit 3.8% year-over-year, the highest since May 2023, with energy pressure further amplifying inflation concerns. Rate cut expectations diverged: prediction markets now price roughly a 69% probability of zero Fed rate cuts in 2026, a clear departure from the rate cut expectations at the start of the year. A firm dollar and rising yields: the 10-year Treasury ( US10Y ) approached 4.5% on June 3 as higher oil prices and resilient labor market signals kept risk appetite on a short leash. Will BTC Keep Grinding Lower? For Bitcoin price, the near-term map is defined by two levels. First, the downside. The $60,000 mark is the next major psychological support and roughly aligns with miner production-cost estimates. A clean break below it would likely mean Bitcoin continues to search for a lower bottom. In both time and price, that would be relatively consistent with the low zone of the four-year cycle. Second, the upside. Reclaiming $70,000 is the precondition for arguing the worst is priced in, and between these levels expect range-bound chop driven by macro headlines. With no clean near-term resolution in sight around the Strait of Hormuz, a strong bullish catalyst is hard to come by. The June 10 CPI print is worth watching. This is also why the SpaceX ( SPCX ) listing on June 12 matters more than it first appears. The IPO is set to raise roughly $75 billion at a $1.77 trillion valuation, the largest on record, with 30% of the float allocated directly to retail. Some of that capital may come from other risk buckets, including crypto, especially among retail and crossover investors. The reasons are straightforward: Historical return appeal: SpaceX’s valuation expanded from roughly $500 million in its early years to around $800 billion by late 2025, a roughly 1,600x increase. That historical return memory can strengthen demand for the IPO. Crypto weakness: with sentiment already fragile and no clear near-term reversal catalyst, some capital may rotate out of crypto toward a more closely watched new listing. Lower bond appeal: with Treasuries under pressure, some capital may look for a more attractive risk-asset destination. Equity flow rotation: outside the dominant AI names, weaker stocks and lagging sectors could see capital rotate into SPCX. The net effect is higher market concentration. For crypto, losing capital at this point would add pressure to an already weak market, and token prices could move lower. For equities, index strength is already highly concentrated in a small group of AI names, and concentrated markets are usually less resilient. Liquidity Is Missing, Selling Pressure Is Not First, ETF demand remained negative. U.S. spot Bitcoin ETFs posted 13 consecutive sessions of net outflows from May 15 to June 3, with total withdrawals reaching about $4.33 billion. This confirms that the main institutional demand channel of the last cycle is no longer absorbing supply. Second, stablecoin liquidity is not stepping in as fresh buying power. All-stablecoin exchange reserve data shows no meaningful reserve build-up since early June. Instead, reserves have been trending lower since around May 18. In simple terms, no stablecoin inflow means no fresh buying power. A sustained decline also suggests capital is moving away from exchange liquidity, reducing the dry powder available to support prices. Third, BTC exchange netflow points to heavier spot selling pressure. Since around May 24, BTC netflow has been mostly positive, meaning more BTC has been entering exchanges than leaving. This is bearish for spot markets because rising exchange supply historically correlates with stronger selling pressure. The conclusion is straightforward: the market is facing pressure from both sides. ETF demand is negative, stablecoin buying power is not building, and BTC supply has been moving onto exchanges. Without fresh liquidity to absorb that supply, Bitcoin is still searching for a bottom. Leverage Was Hit, But Not Cleared This week, the liquidation wave was heavily long-sided. As BTC fell sharply, long positions were hit the hardest. On June 2 alone, total crypto liquidations reached roughly $1.76 billion, with longs accounting for about 90% of the total. However, open interest did not fall with the liquidations. Exchange BTC open interest, measured in BTC terms, climbed to a record high on June 3, reaching roughly 784K BTC. In other words, derivatives exposure remained extremely elevated even after the price drawdown. Week Ahead Jun 10: U.S. CPI (May) Jun 11: U.S. PPI (May) Jun 11: SpaceX IPO pricing Jun 12: SpaceX Nasdaq debut SpaceX is raising roughly $75 billion at a $1.77 trillion valuation, the largest IPO on record. Two angles matter for crypto. First, the investment opportunity: private secondary markets were trading at $129 to $137 heading into pricing, so the IPO carries little discount to secondary, and the first day will be the real price discovery event that sets how aggressively capital chases the name. Second, watch the liquidity siphon effect. The listing is likely to draw capital out of the crypto market, which could compound the current weakness and push BTC lower still. It may also pull capital away from lower-returning U.S. equity positions. That kind of concentrated allocation into a single name reduces the market's overall resilience to risk. Disclaimer: The information provided herein does not constitute investment advice, financial advice, trading advice, or any other sort of advice, and should not be treated as such. All content set out above is for informational purposes only. Original Post Editor's Note: The summary bullets for this article were chosen by Seeking Alpha editors.
8 Jun 2026, 13:52
Congress to Discuss Crypto Tax Rules: What to Watch

The House Ways and Means committee will review draft crypto tax bills covering staking, mining, network fees, and reporting.
8 Jun 2026, 13:52
Ripple Price Analysis: Is XRP Ready for a Comeback After Reclaiming Major Support?
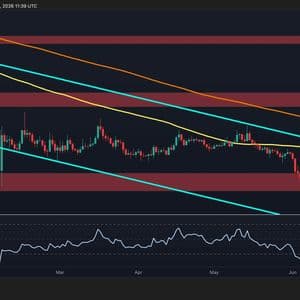
XRP remains under pressure on higher timeframes after extending its decline within a broad descending channel. However, the asset is now attempting to stabilize above an important support region while showing early signs of recovery against Bitcoin. The coming sessions could determine whether it can establish a meaningful bottom or continue its longer-term downtrend. Ripple Price Analysis: The USDT Pair On the daily timeframe, XRP has recently broken below the local support around $1.30 and quickly dropped into a major demand zone between $1.10 and $1.20. This region has historically attracted buyers and once again produced a reaction, with the price rebounding after briefly dipping below the lower boundary of the zone. Despite the bounce, the broader market structure remains bearish. XRP continues to trade inside a long-term descending channel while remaining below both the 100-day moving average at approximately $1.35 and the 200-day moving average near $1.60. The bearish alignment of these moving averages suggests that sellers still maintain control of the higher-timeframe trend. For the buyers, the first challenge is reclaiming the 100-day MA and turning the $1.35-$1.40 region into support. A successful recovery above that area could open the door for a move toward the next major resistance zone around $1.80. On the downside, failure to hold the current support between could expose the channel’s lower boundary and potentially trigger another leg lower. Meanwhile, the RSI has recovered from near-oversold conditions and currently sits around 33, indicating that bearish momentum has eased slightly, although no strong bullish reversal signal has emerged yet. The BTC Pair Against Bitcoin, XRP appears to be showing more constructive price action after several months of underperformance. The pair recently found support near 1,700 sats and has since produced a series of higher lows, suggesting that selling pressure may be weakening. The price is currently trading around the 1,820 SAT region, which coincides with an important resistance area and sits just beneath the declining 100-day moving average. A decisive breakout above this zone could strengthen the recovery narrative and allow XRP to target the next resistance area around 2,000 sats, where the 200-day moving average is also located. The broader trend, nevertheless, remains negative, as the pair is still trading inside a long-term descending channel and below both the 100-day and 200-day moving averages. As a result, any bullish continuation will likely require a sustained break above the 1,850 sats resistance cluster. Moreover, the RSI on the BTC pair has improved notably and is hovering near the neutral 55 level, reflecting strengthening momentum compared to the USDT chart. As long as XRP holds above the 1,700 sat support, the probability of an extension toward higher resistance levels remains elevated. However, a breakdown below that floor would invalidate the recent recovery structure and shift focus toward the lower channel support near 1,500 sats. The post Ripple Price Analysis: Is XRP Ready for a Comeback After Reclaiming Major Support? appeared first on CryptoPotato .


