


 Invest ideas
News
19 May 2026, 12:19
Ripple Price Analysis: Is XRP Heading Toward $1 as Sellers Resume Control?
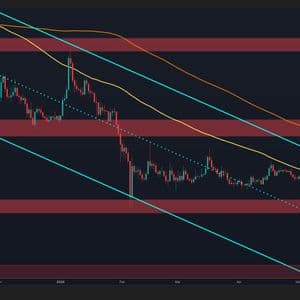
Ripple’s XRP remains trapped in a prolonged consolidation phase after months of persistent bearish pressure, with recent price action reflecting indecision and a lack of strong directional momentum. The asset is now hovering near critical support levels, where the next breakout could define the medium-term trend. Ripple Price Analysis: The Daily Chart On the daily timeframe, XRP continues to trade inside a broad descending channel while remaining below both the 100-day and 200-day moving averages, confirming that the larger bearish structure remains intact. Recent price action shows another rejection near the channel’s upper threshold around the $1.4 region, reinforcing sellers’ dominance whenever the market attempts recovery. Despite several rebounds since February, the bulls have failed to generate enough momentum to reclaim higher resistance zones. The asset is currently hovering around the mid-range support near $1.35, with the broader consolidation structure tightening. If selling pressure intensifies and XRP loses the key $1.3 support area, the next major downside target would emerge around the $1.1 region. Conversely, reclaiming the 100-day MA and breaking above the descending channel’s upper boundary would be the first signal suggesting weakening bearish momentum. Until then, the path of least resistance remains sideways to bearish. XRP/USDT 4-Hour Chart The lower timeframe highlights XRP’s prolonged consolidation between the $1.3 support zone and the $1.55 resistance region. The asset has repeatedly oscillated within this range over recent months, failing to establish a decisive trend. The most recent update shows increasing weakness near the upper boundary, followed by a rejection and gradual decline toward the middle of the range. This suggests buyers are becoming less aggressive while sellers continue defending higher levels. As long as XRP remains inside this structure, continued choppy movement between support and resistance is the most probable scenario. A confirmed breakdown below the $1.3 floor could trigger an accelerated decline toward lower demand zones near $1.1. On the other hand, a breakout above the $1.55 resistance would likely initiate a stronger recovery phase toward the broader resistance cluster around $1.8. For now, the token appears to be compressing within a neutral range, with market participants awaiting a catalyst capable of producing a meaningful breakout. The post Ripple Price Analysis: Is XRP Heading Toward $1 as Sellers Resume Control? appeared first on CryptoPotato .
19 May 2026, 12:16
XRP Enters a Volatility Vacuum — What will Still Waters Yield?

XRP Enters Volatility Vacuum as Market Compression Signals an Imminent Expansion Move Market analyst Xaif Crypto suggests XRP may be entering a so-called volatility vacuum, a phase where market activity tightens, participation slows , and price action becomes unusually compressed. On-chain and derivatives signals point in the same direction that transaction volumes are down roughly 20%, funding rates have turned negative, and liquidations have dropped by about 99%, painting a picture not of fear or hype, but of a market that has quietly reset after a heavy leverage unwind. The decline in transaction activity points to a slowdown in short-term network engagement, but not necessarily weakness. It often signals hesitation in the market, fewer active participants mean less aggressive price discovery, allowing price action to compress and drift within a tighter range rather than trend decisively. More notable is the shift in funding rates, with perpetual futures now turning negative, meaning traders are effectively paying to stay short. This kind of flip usually signals a defensive market posture following a deleveraging phase. But when positioning gets this one-sided, it doesn’t take much to disrupt it; even modest positive catalysts can trigger fast, aggressive repositioning as the market rebalances. Volatility Vacuum Deepens as Liquidations Collapse 99%, Signaling a Coiled Market in Compression The most striking signal is the 99% collapse in liquidations, clear evidence that excessive leverage has already been flushed from the system on both sides. With forced closures largely gone, the market’s natural volatility engine has stalled. Not because conditions are calm, but because there’s little left to trigger sharp cascades. In this kind of environment, price action often tightens, drifting in compression rather than erupting in spikes or crashes. This is what traders call a volatility vacuum, a phase of contraction marked by low volatility, fading participation, and tight price compression. It’s not true stability, but stored tension. The market hasn’t chosen a direction yet since it’s simply coiling, waiting for the catalyst that forces movement. XRP Tightens Into a Volatility Squeeze as Key $1.29–$1.50 Breakout Zone Comes Into Focus Market analyst Ali Martinez highlights an unusually tight Bollinger Band squeeze on XRP’s 3-day chart, one of the most compressed in over a year. Historically, conditions this tight rarely last; volatility tends to snap back, but only after a clear breakout sets direction. He points to the $1.29–$1.50 range as the key battleground, where a decisive 3-day close outside it could define the next major move. A push above $1.50 would tilt momentum toward a bullish expansion into higher resistance zones, while a drop below $1.29 risks unlocking a deeper retracement phase. Until one of those levels breaks, the structure stays neutral, compressed and tightly coiled. Well, XRP is hovering at $1.37 , right in the heart of this squeeze. Market participants are also eyeing a developing symmetrical triangle, with price steadily tightening toward the apex, a setup that often precedes a sharp volatility breakout. On the longer-term chart, bullish analysts still highlight a multi-year cup-and-handle structure that remains intact, with some eyeing extended upside potential if liquidity cycles and macro conditions line up. In more aggressive scenarios, projections stretch toward the $27 region, though this outcome is highly speculative and far removed from the current compression realities.
19 May 2026, 12:12
XRP-Linked Ripple Never Had Gag Order, Clarifies SEC Veteran; Binance Drops Major Uniswap and Bitcoin Pairs; Crypto Faces Shai-Hulud Malware Again - Morning Cry...

An SEC veteran clarifies that Ripple never faced a gag order, while Binance removes low-volume BTC and UNI pairs, and a new Shai-Hulud malware version wave hits Web3.
19 May 2026, 12:08
Bhutan Denies Dumping 13,000 BTC Amid Wallet Activity Concerns

Bhutan has denied reports that it sold a major portion of its Bitcoin holdings, as analysts continue to monitor large wallet transfers linked to the country.
19 May 2026, 12:05
Bitcoin Price Action Stalls Near $76K Support as Volatility Compresses
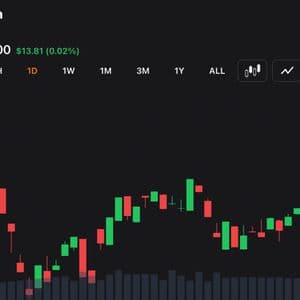
Bitcoin hovered near $76,738 early Tuesday as traders watched a tightening consolidation range follow a strong multiweek advance. Technical indicators across the one-hour, four-hour, and daily charts remained mixed, pointing to cautious momentum. Support around $76,000 held as the critical level shaping near-term price direction. Bitcoin Chart Outlook On the one-hour bitcoin chart, intraday price
19 May 2026, 12:02
Bitcoin Stuck In Limbo As Gold Outshines Crypto

These days, the only players expressing interest in bitcoin are those that bought at the top and are now left carrying the bag. Bitcoin just ain’t bitcoin anymore.


