


 Invest ideas
News
17 May 2026, 14:56
Bitcoin Dev Jameson Lopp Outlines 5 Crypto Security Rules After New Google Form Phishing Trick Emerges

Bitcoin dev Jameson Lopp details a sneaky Google form phishing trick targeting crypto holders.
17 May 2026, 14:44
Bitcoin falls below 79,000 dollars after peaking at 82,477

🚨 Bitcoin dropped below 79,000 dollars after testing 82,477. Market eyes if $BTC can reclaim and hold above 79,123. Continue Reading: Bitcoin falls below 79,000 dollars after peaking at 82,477 The post Bitcoin falls below 79,000 dollars after peaking at 82,477 appeared first on COINTURK NEWS .
17 May 2026, 14:29
276 arrested in $BTC romance scam crackdown in Dubai

🚨 276 people were arrested in Dubai in a massive $BTC romance scam bust. This was the first-ever joint police operation by China, the US, and the UAE against crypto scams. 👀 Key point: Authorities shut down nine organized crime centers involved in emotional manipulation and crypto fraud. Continue Reading: 276 arrested in $BTC romance scam crackdown in Dubai The post 276 arrested in $BTC romance scam crackdown in Dubai appeared first on COINTURK NEWS .
17 May 2026, 14:29
Frustration Fades as XRP Tightens Within a Symmetrical Triangle Apex — Who will Carry The Day Bears or Bulls?

XRP Coils at Key Support as Volatility Squeezes — Breakout or Breakdown Next? XRP’s price action may appear quiet and uneventful, but some analysts argue that this calm is exactly what matters most. Market analyst ChartNerd suggests XRP is now in a tightly compressed trading range often seen ahead of major breakouts. After weeks of sideways movement, weakening volatility, and repeated tests of support, the asset appears to be coiling near a key technical zone where a decisive move in either direction could be imminent. Per CoinCodex data, XRP is trading at $1.42 , sitting just above a key support zone that traders are watching closely. “It’s boring. It’s frustrating. It happens,” noted ChartNerd, capturing the grind of a drawn-out consolidation marked by stalled rallies and repeated fakeouts. Still, this kind of tightening price action has often come before sharp volatility spikes, as the market builds pressure ahead of a decisive move in either direction. At the heart of the current setup is XRP’s tightening trading range. Sellers have repeatedly tried to break it lower, but support keeps holding firm, while buyers still lack the strength to push decisively through resistance. The result is a steadily compressing price structure that many analysts compare to a coiled spring. Historically, this kind of compression rarely lasts, and when it finally resolves, it tends to do so with a sharp, directional move. XRP at a Technical Crossroads as Compression Signals an Imminent Breakout Move Volatility is fading as XRP continues to defend key support levels, tightening the pressure between buyers and sellers. When this kind of equilibrium breaks, it typically triggers a sharp move in one direction, and analysts say the next one to two weeks could be decisive as XRP approaches a clear technical inflection point. A firm hold above the $1.42 zone would reinforce bullish momentum and increase the chances of an upside breakout. If support gives way, however, it could open the door to renewed short-term downside before any broader recovery trend can take shape. Despite short-term uncertainty, longer-term XRP bulls are still anchored to the broader macro structure. Some analysts point to a multi-year cup-and-handle formation that has been building for nearly eight years. If the pattern fully matures, upside projections in some models extend toward the $27 region. For now, patience dominates the narrative. On the surface the chart looks quiet, but beneath the consolidation, XRP continues to build pressure that often precedes a significant directional expansion.
17 May 2026, 14:04
Ethereum News: Donald Trump-Linked World Liberty Sells 4,870 ETH for $10.61M
A wallet linked to the Trump-affiliated World Liberty Financial project sold 4,870 ETH for about $10.61 million in USDC, according to market data shared by crypto trackers. The sale was executed at an average price of roughly $2,178 per ETH. Ethereum traded near $2,185 after the transaction, moving slightly lower during the session as the asset continued to face pressure from exchange-traded fund outflows and broader market caution. ETH has been trading near the lower part of a recent channel, with analysts watching whether buyers defend the $2,150 support zone. The World Liberty sale comes as the project remains under public and legal scrutiny. The Trump-linked crypto venture has faced questions over its governance token, treasury activity, investor restrictions, and reported disputes with early backers. World Liberty Sells ETH as Market Watches Treasury Activity The 4,870 ETH sale adds to recent treasury management activity tied to World Liberty Financial. The project has previously drawn market attention because of its political links, token structure, and reported asset movements. The latest sale converted ETH into USDC, a dollar-pegged stablecoin widely used in crypto trading and treasury management. Such transactions are often watched by traders because large wallet sales can affect market sentiment, especially when they involve politically connected or widely followed projects. World Liberty’s WLFI governance token has also faced heavy volatility. The token was recently trading near $0.08, far below its earlier high. However, as of now, early investors are allowed to unlock 20% of their holdings, creating new supply dynamics in the market. The project has also faced scrutiny over a reported $75 million loan using WLFI tokens as collateral. Lawmakers and legal observers have questioned whether the structure raises investor protection and liquidity concerns. Ethereum ETFs Record Heavy Weekly Outflows Ethereum’s market backdrop remains weak after another week of U.S. spot crypto ETF outflows. Spot Ethereum ETFs recorded about $255.11 million in net outflows for the week of May 11 to May 15, according to data cited by market reports. BlackRock’s Ethereum ETF reportedly sold about 77,567 ETH during the week, while Fidelity sold about 25,770 ETH. Grayscale sold about 7,409 ETH, and ARK 21Shares sold 637 ETH. VanEck was among the few issuers listed as buying ETH during the same period. The broader U.S. spot crypto ETF market recorded roughly $1.13 billion in total net outflows last week, including about $1 billion from Bitcoin ETFs. The outflows show that institutional fund flows remained negative across both major crypto assets. Ethereum’s price has held near $2,150 to $2,185 despite the fund withdrawals. Analyst Ali Martinez noted that ETH had returned to the lower end of its channel and said a rebound could occur if the $2,150 support area holds. If buyers defend that zone, traders are watching possible moves toward $2,280 and $2,390. A break below the lower support area could weaken the setup and increase attention on deeper demand levels. Legal Pressure Builds Around WLFI World Liberty Financial is also facing legal and regulatory pressure. Senator Elizabeth Warren has reportedly requested that the Securities and Exchange Commission investigate the project for possible securities law issues and investor disclosures. Legal analysts have argued that WLFI may face questions under the Howey test, which is used to assess whether an asset is an investment contract. The project has not been found liable in court on those claims. The project is also involved in a dispute with Tron founder Justin Sun, who reportedly invested $45 million in World Liberty. Sun has alleged that his tokens were unfairly frozen and that the project used account controls to restrict his ability to sell or move assets. World Liberty executives, including Zach Witkoff and Eric Trump, have rejected Sun’s claims and described them as meritless, according to reports. The dispute remains part of a wider legal fight around investor rights, token controls and project governance.
17 May 2026, 14:03
Ethereum Price Prediction: Is ETH Setting Up for a Drop to the $1.8K Zone?
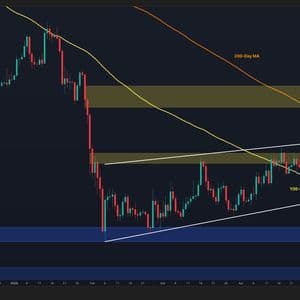
Ethereum’s recent recovery phase has weakened considerably after repeated failures beneath the $2.4K major resistance level. The latest price action suggests bearish momentum is gradually building, while buyers struggle to maintain control above important support regions. Ethereum Price Analysis: The Daily Chart On the daily timeframe, ETH has experienced a notable bearish rejection after multiple unsuccessful attempts to reclaim the key resistance zone around $2.3K-$2.4K. This region remains highly significant as it has acted as an important supply area where sellers continue to defend aggressively. The latest decline has pushed the price back toward the 100-day MA, making it the next dynamic support level. A confirmed breakdown below this moving average could trigger another bearish leg toward the crucial demand zone around $1.8K-$1.85K. Meanwhile, the broader structure still resembles a corrective phase beneath the descending 200-day MA near the $2.6K region, suggesting the higher timeframe trend remains fragile. Unless Ethereum manages to reclaim the $2.4K resistance and stabilize above it, bearish continuation toward lower support levels currently appears to be the more probable scenario. ETH/USDT 4-Hour Chart On lower timeframes, ETH recently broke the lower boundary of its ascending wedge formation, providing one of the clearest bearish signals observed in recent weeks. Following the breakdown, price accelerated lower and reached the first highlighted demand region around $2.18K-$2.22K. The reaction at this support zone will likely determine Ethereum’s next directional move. If buyers succeed in defending the current region, short-term consolidation or a temporary rebound toward the broken wedge boundary near $2.3K becomes possible. However, failure to hold the $2.2K support would expose the next major demand zone around $2.05K-$2.1K. Notably, the recent breakdown also invalidates much of the prior bullish recovery structure, indicating sellers have regained control over short-term momentum. Unless ETH quickly reclaims the broken trendline and returns above the $2.3K region, further downside pressure remains likely in the coming sessions. Sentiment Analysis The Taker Buy Sell Ratio measures the balance between aggressive buyers and aggressive sellers in the futures market. Values above 1 indicate buy-side dominance, suggesting market participants are executing more market buy orders, while readings below 1 reflect stronger selling pressure and bearish sentiment. As a result, this metric is often used to evaluate short-term momentum shifts and trader conviction. Recently, the indicator has remained persistently below the neutral 1 threshold, currently hovering around the 0.96–0.97 region. This suggests that sell-side activity continues to dominate derivatives markets, aligning closely with Ethereum’s recent bearish price action and the breakdown observed on lower timeframes. Although minor rebounds in the ratio have appeared, buyers have repeatedly failed to regain sustained control. This ongoing weakness implies that aggressive demand remains limited, increasing the probability of continued downside pressure in the coming weeks. If the Taker Buy Sell Ratio remains below 1 while ETH trades beneath key resistance levels around $2.3K-$2.4K, the bearish scenario discussed in the technical analysis could strengthen further, potentially driving the price toward lower support zones around $2.1K and eventually the critical $1.8K region. The post Ethereum Price Prediction: Is ETH Setting Up for a Drop to the $1.8K Zone? appeared first on CryptoPotato .
