


News
10 Jun 2026, 05:43
Bitcoin Slips Under $61K as ETFs Bleed a Third Day, Saylor NAV Defense Draws Backlash
Bitcoin News Strategy chairman Michael Saylor drew criticism after defending the firm's latest Bitcoin purchase using net asset value rather than the BTC Yield and BTC-per-Share metrics he had long...
10 Jun 2026, 05:28
Bitcoin’s CPI Day Test: Why $68K–$80K Is the Reclaim Zone That Matters

Bitcoin heads into another CPI day with a narrow margin for error. Traders are watching whether the market can reclaim and hold the $68,000$80,000 band — a zone that has repeatedly flipped between support and resistance during recent macro shocks. The next U.S. CPI print is scheduled for Wednesday, June 10, 2026 at 8:30 a.m. ET, according to the U.S. Bureau of Labor Statistics ( U.S. Bureau of Labor Statistics (CPI) ). With liquidity thinning around high-impact releases, the first move often exaggerates direction before price settles back into the prevailing range. In the run-up, Bitcoin has telegraphed where the fights happen. After a hotter-than-expected CPI in mid-May, BTC briefly dipped toward ~$79.8k and rebounded near ~$81.2k the next day — reinforcing $80k as a contested pivot ( CoinDesk ). Then on June 3, amid ETF redemptions and a rotation into AI equities, price probed down to roughly $65.7k, testing lower support and triggering liquidations ( CoinDesk ). Those swings outline why $68k$80k has become the CPI-day reclaim zone to watch. Editor's note: The streak of spot ETF outflows changed how quickly BTC faded rallies. On two CPI weeks I tracked closely, the first move was routinely faded within 30 minutes, but the follow-through hinged on whether flows stabilized by the close. My takeaway: the $68k$80k band matters less as a magical number and more as a gauge of acceptance. If itis reclaimed and held, traders lean in; if not, they stand back. 97 Lena Carter $68k$80k matters because itis where Bitcoin has most recently flipped between supply and demand during CPI-driven volatility. A decisive reclaim and acceptance inside — and ideally above — this band keeps the broader uptrend argument alive; repeated failures to hold it raise the odds of deeper retracements . Into the June 10 print, ETF flows and cross-asset moves (notably AI equities) could amplify wicks on either side before direction is clarified. $80k is a pivot that rejected on hot CPI and was defended soon after, marking a key resistance-to-support battleground. Early-June selling probed the mid-to-high $60k area, mapping the lower edge of the range. ETF outflows and AI rotation have magnified intraday swings around macro data. Confirmation comes from acceptance and follow-through, not the first 515 minutes after the release. What is the $68K$80K reclaim zone, exactly? Traders use reclaim to describe price moving back over a level or band that recently failed — and then holding it on retests. The $68k$80k area is the most active recent battleground: sellers capped rallies near $80k around a hot CPI, while buyers defended deep pulls into the high-$60ks during ETF-driven stress. Itis the practical middle ground where the market decides trend continuation versus deeper mean reversion. Why a band instead of a single level? CPI days widen spreads and reduce liquidity at the top of book. The market hunts stops above and below obvious price markers. Using a band helps frame acceptance (multiple closes and higher lows within it) rather than reacting to every wick. Evidence of this behavior surfaced mid-May when BTC briefly slipped toward ~$79.8k before reclaiming ~$81.2k within a day ( CoinDesk ). Then, on June 3, it undercut supports into the mid-$60ks during heavy redemptions before snapping back ( CoinDesk ). Together, those moves sketch the reclaim zone now under scrutiny. How could the June 10 CPI print move Bitcoin within this band? Macro prints change the path, not the destination: they alter how quickly price reaches the next liquidity pool. The June 10 CPI release at 8:30 a.m. ET ( U.S. Bureau of Labor Statistics (CPI) ) creates three broad paths. None guarantees a trend; each sets odds for whether $68k$80k is accepted, rejected, or chopped through. Use the following table to map scenarios to behaviors and focus points. Treat it as a playbook, not a promise — CPI reactions are path-dependent and often mean-reverting after the first impulse. CPI outcomeFirst BTC reaction (typical)Implication for $68k$80kTrader focusCooler than expectedUpward impulse; spread widensFaster tests of $80k; potential break and hold if volume confirmsWatch for acceptance above prior highs; avoid chasing initial wickInline with expectationsWhipsaw; range revertsBand acts as magnet; chop risk high inside $68k$80kFade extremes back to mid-range; wait for structure to formHotter than expectedDownward impulse; stops triggerRisk of losing $68k; deeper probes toward prior liquidity sweepsLook for failed breakdowns and reclaim signals before risk-on Timing matters too. Initial 15 minute candles often overrun levels as algos react to the surprise component. Patience around the 1530 minute mark can reduce slippage and false entries, especially near the edges of the reclaim zone. What are ETF flows and cross9asset rotation saying about risk? Flows set the backdrop. Late May carried a marked risk-off tone in listed products: CoinShares9 weekly report (Volume 287) showed about US$1.47 billion of outflows from digital-asset funds, with Bitcoin products accounting for roughly US$1.315 billion — the year9s largest weekly BTC outflow at that point ( Yahoo Finance reporting CoinShares). In the U.S., spot Bitcoin ETFs saw their longest and largest withdrawal streak since launch — approximately US$3.45 billion removed over 11 straight sessions through early June, according to CoinDesk . That unwind coincided with strength in AI-related equities, a rotation that can siphon incremental risk capital away from BTC on data days. Why does this matter for $68k$80k? Sustained outflows tend to weaken bounces into resistance and deepen dips into support, making acceptance inside the band harder to sustain. Conversely, if flows stabilize or turn modestly positive into or after CPI, the market often grants more time above reclaimed levels, improving the odds that a break over $80k sticks. Where are the nearby invalidation levels and liquidity traps? Invalidations help you survive uncertainty. If the market accepts below the lower-$70ks and repeatedly fails to reclaim $68k on hourly closes, it signals that CPI has likely shifted the balance toward deeper retracement. That doesnt predict a crash — it warns that dip-buying has lower odds until fresh demand appears. On the upside, multiple attempts and holds above $80k, especially on expanding spot and futures volume, improve the case for range expansion. The mid-May rejection just under $80k and swift reclaim near ~$81.2k show how quickly this pivot can flip when liquidity returns ( CoinDesk ). On the downside, the early-June sweep toward ~$65.7k is a reminder that liquidity vacuums can extend further than expected in ETF redemption windows ( CoinDesk ). Checklist for confirmation: higher lows on 1560m inside the band Funding and basis normalizing after the first impulse ETF net flows stabilizing or improving day-over-day Correlation with AI mega-cap indices easing back toward neutral Failed breakdowns or breakouts that quickly reverse back into $68k$80k Pro tip: On CPI days, the first drive often runs stops on both sides of the prior day9s range. Let the initial impulse and fade complete before judging whether the reclaim is real. Is it smarter to trade the print or wait for confirmation? It depends on your playbook. Event traders might bracket the release with predefined risk, aiming to catch the first expansion. Swing traders often wait for acceptance signals (e.g., two consecutive closes back inside $68k$80k or a clean break-and-hold over $80k) before committing size. Practical tactics include staggering entries, avoiding wide slippage by reducing order size into the print, and using alerts rather than market orders during the first minutes. Options traders can lean on defined-risk structures (debit spreads) to avoid liquidation risk if the initial move reverses. Above all, size for volatility. CPI can double or triple normal intraday ranges, especially when structural flows (ETF creations/redemptions) and cross-asset rotations add fuel. A small but repeatable approach typically outperforms all-in bets on single prints. Which instrument fits CPI day: spot, futures, or options? Different vehicles carry different trade-offs when spreads widen and liquidity thins. Heres a high-level comparison to help align tools with intent on CPI day. InstrumentStrength on CPI dayWatch-outsBest used whenSpotSimple exposure, no liquidation riskFull delta; no convexity; capital intensiveYou want clean reclaim confirmation with low operational riskPerpetual futuresFlexible sizing; can hedge quicklyFunding spikes, slippage, liquidation cascadesYoure trading the first impulse but can cut fastDated futuresCleaner basis; defined expiryLess liquid into data; basis can gapYou have a multi-day view post-CPIOptions (calls/puts)Defined risk; convexity if move extendsImplied vols often elevated; decay hurts if chopYou expect a break and hold beyond $68k$80kOptions spreadsReduce premium; target range expansionCapped upside; execution complexityYou want exposure to direction with limited theta bleed Whichever vehicle you choose, map your invalidation to the reclaim band. If price rejects the band and fails to reclaim, reduce risk and reassess rather than averaging down into uncertainty. Common Mistakes Chasing the first candle: Early prints often overrun levels. Wait for structure (higher low or lower high) before sizing up. Using static stops at round numbers: Liquidity hunts cluster around $500 and $1,000 increments; stagger stops or place them beyond obvious pools. Ignoring flows: Large ETF outflows can blunt bounces. Track daily creations/redemptions alongside price to avoid fading strong currents. Over-leveraging perps: Funding spikes and thin books can trigger forced exits. Use reduced size and wider, predefined risk. Forgetting the calendar: CPI at 8:30 a.m. ET can cause overnight gaps for non-U.S. traders; plan positions and alerts ahead of the release. For ongoing macro coverage, real-time levels, and context across digital assets, visit Crypto Daily . Frequently Asked Questions What if CPI is exactly inline does the band still matter? Yes. Inline prints often produce whipsaws that revert to the most recent fair-value area — currently mapped by $68k$80k. The band can act as a magnet until new information (flows, earnings, policy headlines) shifts positioning. Could AI equity strength keep pressure on BTC even if CPI cools? It might. CoinDesk noted BTC weakness alongside strong AI-led equity indices in early June as ETFs saw redemptions. If that cross-asset rotation persists, it can cap upside attempts into $80k even on benign CPI. How do I know a reclaim is real and not just a wick? Look for acceptance: multiple closes within or above the band, rising spot participation, and normalized funding/basis. Failed moves that quickly reclaim the band are stronger signals than breakouts without follow-through. Where does invalidation sit if Im long from inside the band? Theres no universal level, but a practical rule is: if price loses the lower edge (around the high-$60ks) and fails to win it back on retests, reduce or exit. Use time-based stops on CPI day to avoid death-by-a-thousand-wicks. Are options better than futures for CPI? Options provide defined risk and benefit from large, directional moves, but implied volatility is usually elevated into CPI. If you expect chop inside $68k$80k, premium can decay quickly; consider spreads to reduce cost. What data besides CPI could swing BTC this week? Watch for ETF flow prints, major earnings that affect risk appetite, and any policy commentary that shifts rate-cut odds. These can reinforce or negate CPIs initial impulse. Disclaimer: This article is provided for informational purposes only. It is not offered or intended to be used as legal, tax, investment, financial, or other advice.
10 Jun 2026, 05:28
Solana (SOL) Back On The Defensive—Can Bulls Prevent Another Drop?

Solana failed to stay above $67 and corrected some gains. SOL price is moving lower and might aim for another increase if it stays above $63.00. SOL price started a downside correction below $66 against the US Dollar. The price is now trading below $65 and the 100-hourly simple moving average. There was a break below a bullish trend line with support at $66 on the hourly chart of the SOL/USD pair (data source from Kraken). The pair could extend losses if it dips below the $63 zone. Solana Price Dips Again Solana price failed to stay above $67 and started a downside correction, like Bitcoin and Ethereum . SOL dipped below $66 and $65 to enter a short-term bearish zone. There was a move below the 50% Fib retracement level of the upward wave from the $60.12 swing low to the $67.90 high. There was a break below a bullish trend line with support at $66 on the hourly chart of the SOL/USD pair. The price even tested the $63.20 support. Solana is now trading below $65 and the 100-hourly simple moving average. On the upside, the price is facing resistance near the $65 level. The next major resistance is near the $66 level. The main resistance could be $67.20. A successful close above the $67.20 resistance zone could set the pace for another steady increase. The next key resistance is $68. Any more gains might send the price toward the $70 level. Downside Break In SOL? If SOL fails to rise above the $66 resistance, it could start another decline. Initial support on the downside is near the $63.10 zone and the 61.8% Fib retracement level of the upward wave from the $60.12 swing low to the $67.90 high. The first major support is near the $62.20 level. A break below the $62.20 level might send the price toward the $60 support zone. If there is a close below the $60 support, the price could decline toward the $55 support in the near term. Technical Indicators Hourly MACD – The MACD for SOL/USD is gaining pace in the bearish zone. Hourly Hours RSI (Relative Strength Index) – The RSI for SOL/USD is below the 50 level. Major Support Levels – $63.10 and $62.50. Major Resistance Levels – $65.00 and $67.20.
10 Jun 2026, 05:26
Kalshi Perps Hit $1B in Days, ProShares Plans 2x SpaceX ETF, Fable 5 Rattles DeFi
Crypto News Kalshi's perpetual futures crossed $1 billion in cumulative trading volume in under a week, a pace that dwarfs the firm's original prediction-market business. The company's Bitcoin perp...
10 Jun 2026, 05:25
BTC/USDT Spot CVD Chart Analysis: Volume Heatmap and Order Flow Insights as of 6:00 a.m. UTC

BitcoinWorld BTC/USDT Spot CVD Chart Analysis: Volume Heatmap and Order Flow Insights as of 6:00 a.m. UTC As of 6:00 a.m. UTC, the BTC/USDT spot Cumulative Volume Delta (CVD) chart provides a detailed look into the current order book dynamics for Bitcoin. This analysis tool, widely used by active traders, breaks down trading activity into two key visual components: a volume heatmap and a cumulative delta line graph. Understanding the Volume Heatmap The top section of the chart features a Volume Heatmap, which tracks the concentration of trading volume at specific price levels. When the price lingers in a particular range or makes a significant move, the background color on the heatmap brightens. These brighter areas are often interpreted by traders as potential zones of support or resistance, as they represent price levels where a high volume of transactions has occurred. This can help identify where the market might react if revisited. Decoding the Cumulative Volume Delta (CVD) The lower section of the chart displays the Cumulative Volume Delta (CVD) indicator. This metric categorizes buy and sell orders by trade size and tracks their cumulative impact over time. As the volume of buy orders increases, the corresponding colored line on the chart rises. The chart distinguishes between different order sizes. The yellow line tracks orders ranging from $100 to $1,000, representing retail and smaller-scale trading activity. In contrast, the brown line tracks large orders between $1 million and $10 million, which are typically associated with institutional investors or high-net-worth traders. Monitoring the divergence or convergence of these lines can offer insights into whether retail or institutional sentiment is driving the current price action. What This Means for Traders For traders monitoring the BTC/USDT pair, this CVD chart offers a real-time snapshot of order flow and market microstructure. By observing which colored line is rising more steeply, one can gauge the relative strength of buying or selling pressure from different market participants. A sharp rise in the brown (institutional) line, for instance, may signal significant large-player interest at current levels, while a sustained increase in the yellow (retail) line might indicate broader market participation. Conclusion The BTC/USDT Spot CVD chart as of 6:00 a.m. UTC provides a nuanced view of the order book, blending volume concentration data with categorized order flow. For traders focused on short-term price movements and market depth, this chart remains a valuable tool for understanding the forces at play behind Bitcoin’s price action. FAQs Q1: What does the Cumulative Volume Delta (CVD) measure? A1: The CVD measures the cumulative difference between buying and selling volume over time, categorized by trade size. A rising line indicates net buying pressure, while a falling line suggests net selling pressure. Q2: How is the volume heatmap on the chart created? A2: The heatmap is generated by tracking the amount of trading volume at each price level over a given period. Price levels with higher trading activity appear brighter on the chart, highlighting areas of potential support or resistance. Q3: Why are the yellow and brown lines significant? A3: The yellow line tracks smaller retail trades ($100–$1,000), while the brown line tracks large institutional trades ($1M–$10M). Comparing their movements helps traders understand whether retail or institutional investors are driving market trends. This post BTC/USDT Spot CVD Chart Analysis: Volume Heatmap and Order Flow Insights as of 6:00 a.m. UTC first appeared on BitcoinWorld .
10 Jun 2026, 05:24
XRP drops 4.5% as heavy selling breaks another support level
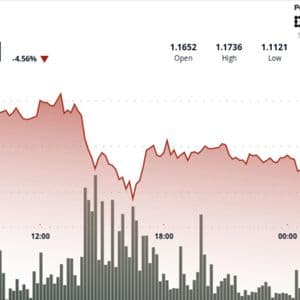
XRP lost the $1.13 area on elevated volume, leaving traders focused on whether the latest selloff marks a final washout or the start of a deeper move toward $1.00.


