


 Invest ideas
News
16 May 2026, 05:25
US Spot Ethereum ETFs Extend Losing Streak to Five Days With $65.6M in Outflows

BitcoinWorld US Spot Ethereum ETFs Extend Losing Streak to Five Days With $65.6M in Outflows U.S. spot Ethereum exchange-traded funds recorded $65.64 million in net outflows on May 15, extending a losing streak to five consecutive trading days, according to data compiled by Trader T. The sustained withdrawals reflect a shift in investor sentiment toward the second-largest cryptocurrency by market capitalization. Breakdown of Outflows by Fund The latest outflow day was led by BlackRock’s iShares Ethereum Trust (ETHA), which saw $50.35 million exit the fund. Fidelity’s Ethereum Fund (FETH) followed with $11.08 million in net outflows. Other spot Ethereum ETFs did not report significant movements, indicating the selling pressure was concentrated among the largest issuers. Context and Market Implications The five-day outflow streak marks a notable shift from the relatively stable inflows seen earlier in the year. Spot Ethereum ETFs, which launched in mid-2024, have experienced periods of both strong retail and institutional interest, but the current trend suggests growing caution among investors. Market analysts point to broader macroeconomic uncertainty, including persistent inflation data and shifting expectations for Federal Reserve interest rate cuts, as potential catalysts for the capital rotation out of digital assets. Ethereum’s spot price has also faced headwinds, trading below the $3,000 level during parts of May. The correlation between ETF flows and underlying asset prices remains a closely watched metric, as persistent outflows can amplify downward price pressure in the short term. What This Means for Investors For holders of spot Ethereum ETFs, the consecutive outflows serve as a signal to monitor market conditions and portfolio exposure. While daily flows can be volatile, a sustained trend of capital leaving these products may indicate a broader reassessment of Ethereum’s near-term outlook. However, it is important to note that ETF flows are only one data point and do not necessarily predict long-term price direction. Conclusion The fifth straight day of net outflows from U.S. spot Ethereum ETFs, totaling $65.64 million, underscores a cautious investor stance amid macroeconomic uncertainty and subdued price action. With BlackRock and Fidelity funds bearing the brunt of the redemptions, market participants will be watching for any reversal in the coming sessions to gauge whether sentiment is stabilizing. FAQs Q1: What is a spot Ethereum ETF? A spot Ethereum ETF is an exchange-traded fund that directly holds Ethereum (ETH), allowing investors to gain exposure to the cryptocurrency’s price movements without buying or storing the asset themselves. Q2: Why are Ethereum ETFs seeing outflows? Recent outflows may be driven by a combination of macroeconomic factors, including persistent inflation, uncertainty around Federal Reserve policy, and Ethereum’s own price weakness below key support levels. Q3: Should I be concerned about the outflows? While consecutive outflows indicate short-term bearish sentiment, ETF flows are just one metric. Investors should consider broader market conditions, their own risk tolerance, and long-term investment goals before making decisions. This post US Spot Ethereum ETFs Extend Losing Streak to Five Days With $65.6M in Outflows first appeared on BitcoinWorld .
16 May 2026, 05:23
Ethereum Price Analysis: Is ETH Finally Attempting a Real Breakout?
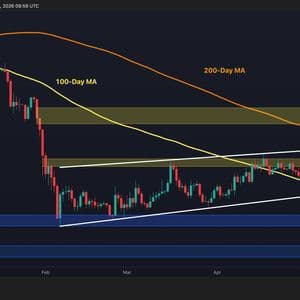
Ethereum is trading above $2.2k as the third week of May gets underway. The asset is on the lower end of its range over the past two weeks after another rejection. The aggressive long positioning that had built up into the $2.4k resistance zone has been unwound, and the price chart indicates that more consolidation is likely to happen in the coming days. Ethereum Price Analysis: The Daily Chart On the daily chart, ETH is still trading above the 100-day moving average (~$2.15k), which is currently the only positive sign on this timeframe. The mildly ascending channel from the February low also remains technically intact, and its lower boundary is rising toward $2.1k and will act as another dynamic support level. The $2.4k supply zone has now rejected ETH several times without a single sustained close above it. The 200-day moving average (~$2.6k) is the next ceiling above the horizontal level and the higher boundary of the channel. To rebuild the case for a recovery, ETH needs to first stabilize above the $2.4k resistance level and then reclaim the 200-day moving average, but neither of these moves looks straightforward given current momentum. On the downside, a close below $2k would be the massive structural damage that the buyers would have to prevent from happening. ETH/USDT 4-Hour Chart The pink descending wedge that had been compressing the price since the mid-April high is resolving to the downside, as the lower boundary near $2.26k is getting broken. The asset is now sitting just above the $2.2k support zone that has held on during recent weeks. The RSI on this timeframe is hovering in the 40–45 range, soft but not yet at the oversold levels that could trigger a bounce from this support band. The $2.2k zone is the critical level to watch over the next few days. A successful rebound here would keep the short-term bullish structure alive and set up another attempt at reclaiming the $2.4k zone. However, a confirmed break below $2.2k opens the door toward the $2k-$2.1k support zone and the daily channel’s lower boundary as the last meaningful lines of defense before $1.8k. Sentiment Analysis After hitting a multi-year low of approximately 14.5M ETH in late April, exchange reserves have ticked back up to 14.9M, which is a modest increase of around 400k ETH over the past few days. The timing is important because the reserve increase began as the price approached $2.4k and has continued through the pullback to current levels. This suggests that a portion of the ETH returning to exchanges represents holders who accumulated near the February lows and moved supply onto exchanges as the price approached their target exit zone. Yet, the broader picture remains structurally supportive. 14.9M ETH is still historically low by any measure, and the multi-month outflow trend has not reversed. But the subtle shift from declining to slightly rising reserves at exactly the resistance level that has rejected the price several times is not coincidental. It helps explain why $2.4k has been so difficult to clear. Each approach has triggered incremental supply from low-cost holders, absorbing demand before a breakout can materialize. Until reserve flows resume their decline, signaling that those holders have finished distributing, the supply wall at $2.4k is likely to persist. The post Ethereum Price Analysis: Is ETH Finally Attempting a Real Breakout? appeared first on CryptoPotato .
16 May 2026, 05:00
XRP ETF Accumulation Pushes Marex Group Among Top Holders

Marex Group’s own stock climbed more than 15% in a week after the Nasdaq-listed financial services firm disclosed a combined $9.4 million position across two spot XRP exchange-traded funds, landing it among the top institutional holders of XRP ETF shares in the US. A Filing That Moved Markets The disclosure came through a 13F filing with the US Securities and Exchange Commission. Marex reported holding 356,865 shares of the Canary XRP ETF, valued at roughly $5.1 million as of the first quarter of 2026. That position grew 51% from the previous quarter, when the firm held 173,298 shares. On top of that, Marex bought 286,021 new shares in the Bitwise XRP ETF, worth nearly $4.3 million. The combined holdings pushed the firm among leading institutional ETF holders. MEX shares closed up 4.20% on Wednesday at $58.25. Year-to-date, the stock is up more than 50%. The firms ahead of Marex are not small players. Goldman Sachs leads the pack with $152.16 million in XRP ETF exposure. Millennium Management holds more than $27 million across multiple spot XRP funds. Marex sits well behind both, but its aggressive buying in a single quarter set it apart from many of its peers. Strategy Stock Gets A Boost Too Beyond XRP, Marex also added to its position in Strategy, the Bitcoin-focused company formerly known as MicroStrategy and traded under the ticker MSTR. The firm increased its share count from 2.9 million to 3.4 million. At the same time, it trimmed its call options from 108,100 down to 65,500. It also expanded its stake in Strategy’s perpetual preferred shares, known as STRK, from 4,400 to 16,401. Strategy stock closed down 3.4% at $178.03 on Wednesday and dipped another 0.20% in premarket trading Thursday. Marex also cut exposure in several other digital asset holdings, including TON Strategy and Bitmine Immersion Technologies. Steady Amid The Disclosure XRP was trading at $1.43 at the time of the report, with a 24-hour range between $1.41 and $1.47. Institutional Interest In XRP ETFs Keeps Building The Marex filing adds to a growing list of institutional disclosures showing Wall Street firms taking positions in spot XRP funds. Ripple CEO Brad Garlinghouse has publicly made the case for XRP’s unique role in financial markets, and reports indicate that growing partnerships tied to Ripple have contributed to rising interest from large money managers. Sustained buying hasn’t been confirmed yet, though Q1 disclosures appear to signal growing confidence. Featured image from Shutterstock, chart from TradingView
16 May 2026, 05:00
Ethereum Sell Signal That Last Preceded A 63% Drop Flashes Again

Ethereum has seen a Tom Demark (TD) Sequential sell signal on its weekly chart, something that last led to a major drawdown for the asset. Ethereum Has Seen A TD Sequential Sell Signal In a new post on X, analyst Ali Martinez has highlighted a TD Sequential signal that has emerged on the 1-week price of Ethereum. The TD Sequential is an indicator from technical analysis (TA) that’s usually used for spotting trend reversals in an asset’s price. Related Reading: Ethereum Dips To $2,250 As Trader Profit-Taking Hits 3-Week High It involves two phases: the setup and countdown. In the context of the current discussion, the former phase is the one of interest. During the setup, the TD Sequential counts up candles of the same color until the number hits nine. Once the nine candles are in, the indicator signals the exhaustion of the prevailing trend. Below is the chart shared by Martinez that shows the TD Sequential setup that has appeared on the weekly Ethereum price. As is visible in the graph, the TD Sequential has seen a setup complete with nine green candles recently, a potential sign that the bullish trend may be about to reverse for ETH. According to the analyst, the indicator has generally been reliable for ETH during the past year. “Every signal it has flashed on the weekly timeframe has been validated by significant price action,” noted Martinez. In April and June of last year, the indicator flashed buy signals that led into price surges of 86% and 134%, respectively. Similarly, the August sell signal resulted in a drawdown of 63%. Given that Ethereum has just once again seen a TD Sequential sell signal on the weekly, the pattern could follow this time as well. “To me, this suggests Ethereum is entering another corrective phase,” said the analyst. Martinez has given three targets for ETH for various timeframes: $1,900 in the short-term, $1,595 in the mid-term, and $1,090 in the long-term. The last of these levels also happens to be located around the bottom level of a Parallel Channel, as the analyst has pointed out in another X post. The Parallel Channel is a TA pattern that forms whenever an asset trades between two parallel trendlines. The upper line acts as a source of resistance, while the lower one that of support. Related Reading: Bitcoin Falls Below $80,000: Coinbase Sellers To Blame? From the below chart, it’s apparent that Ethereum has recently been trading in the lower half of a long-term Parallel Channel on the weekly timeframe. “$1,071, at the bottom of the channel, looks like a strong area to buy Ethereum $ETH,” noted Martinez. It now remains to be seen whether the asset will have to rely on this support level. ETH Price Ethereum has gone down this week as its price is now trading around $2,220. Featured image from Dall-E, chart from TradingView.com
16 May 2026, 04:16
Shiba Inu reserves hit 82 trillion SHIB at major exchanges

🚨 SHIB reserves at exchanges are back above 82 trillion. Increased supply could boost selling pressure in $SHIB. Continue Reading: Shiba Inu reserves hit 82 trillion SHIB at major exchanges The post Shiba Inu reserves hit 82 trillion SHIB at major exchanges appeared first on COINTURK NEWS .
16 May 2026, 04:00
STRC hits $1B trading milestone – U.S. equity flows drive Bitcoin demand

Equity-driven flows raises key questions for Bitcoin demand this cycle.


