


News
27 Mar 2026, 08:14
ONDO Price Prediction: Franklin Templeton’s $1.7 Trillion Weight to Carry

Ondo Finance just landed one of the heaviest institutional co-signs in tokenized finance history, and trading at $0.28 and posting a staggering 10% price jump in 24 hours as its prediction gets bullish. Ondo Finance confirmed it will partner with Franklin Templeton to bring tokenized versions of publicly traded stocks and ETFs to blockchain users via Ondo Global Markets, a platform launched in September 2025 that already reports $620 million in total value locked and $12 billion in cumulative trading volume across 60,000 users. BREAKING Franklin Templeton is partnering with $ONDO to tokenize ALL their ETFs. U.S. equities, fixed income, and gold. Trading 24/7 through crypto wallets. Now remember what $ONDO is already doing on the $XRP Ledger. Ondo's OUSG, backed by BlackRock's BUIDL fund, is… pic.twitter.com/M6hiXvbAGf — X Finance Bull (@Xfinancebull) March 25, 2026 Franklin Templeton will supply investment products and support educational rollout for crypto-native audiences. The move follows a broader central bank and institutional push into tokenized asset infrastructure , with BlackRock and others already testing on-chain settlement rails. The partnership with Franklin Templeton, which oversees $1.7 trillion in assets under management, is moving the coin as it should. Discover: The best crypto to diversify your portfolio with ONDO Price Prediction: $0.3 Resistance To Be Broken This Week? ONDO is running to break the $0,29 channel, and the technical picture is about as ambiguous as it gets. March 26 closed at $0.27 on $80.8 million in volume, respectable activity for a mid-cap RWA token. Key levels to watch: support at $0.25–$0.26, with resistance clustering at $0.285–$0.29. That ceiling has capped every rally attempt in the current consolidation window. A clean close above $0.295 on elevated volume would shift momentum decisively bullish. ONDO USD, TradingView The regulatory clarity narrative that’s lifting other institutional-grade tokens remains a slow-burn catalyst for ONDO specifically, given that tokenized securities sit in a grey zone that regulators haven’t fully addressed across wallet-to-wallet transfers. Discover: The best pre-launch token sales LiquidChain Targets Early Mover Upside as ONDO Tests Key Levels ONDO at $0.28 is a mature, already-discovered trade. The Franklin Templeton partnership is priced into sentiment, and even a rally to the $0.5136 year-end target represents roughly 97% upside from current levels. That’s meaningful. But early-stage infrastructure operating in the same RWA and cross-chain space are still pricing in discovery, not deployment. A new layer emerges. Only a few see it first. The future is LiquidChain ⟁ https://t.co/vqvBcdSj94 pic.twitter.com/R7ZeZ0NPGl — LiquidChain (@getliquidchain) March 24, 2026 LiquidChain ($LIQUID) is a Layer 3 infrastructure project with a specific structural thesis: fusing Bitcoin, Ethereum, and Solana liquidity into a single execution environment. Where most cross-chain protocols force developers to rebuild or bridge repeatedly, LiquidChain’s Deploy-Once Architecture means a single deployment accesses all three ecosystems simultaneously. The presale is live at $0.014 per $LIQUID , with more than $600K raised to date. Core features include a Unified Liquidity Layer, Single-Step Execution, and Verifiable Settlement. Research LiquidChain here. This article is not financial advice. Cryptocurrency investments are highly volatile. Always conduct your own research before making any investment decisions. The post ONDO Price Prediction: Franklin Templeton’s $1.7 Trillion Weight to Carry appeared first on Cryptonews .
27 Mar 2026, 08:13
Why a neutral Bitcoin long/short ratio is bad news for bulls
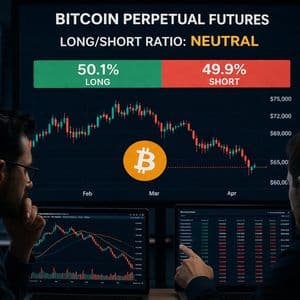
While Bitcoin (BTC) may look stable around the $68,000 region, stability in this case is not a sign of strength; it is a sign of hesitation. And hesitation in a fragile market often leans in one direction: down, especially seeing that BTC has taken a drastic hit days after rising above $71,000 after Trump announced a pause on Iranian power and energy infrastructure . A market stuck in indecision Looking at the derivatives market, the BTC perpetual futures long/short ratio currently sits near an even split, with bulls and bears almost perfectly balanced. At first glance, this might seem like a healthy market where both sides are fairly represented. But in reality, it reveals something far more concerning. It shows that traders lack conviction. Strong uptrends are usually driven by clear dominance from buyers who are confident in higher prices and that confidence is missing right now. At the moment, instead of aggressive accumulation, the market is filled with participants waiting for confirmation. That waiting creates a vacuum where price struggles to move upward with any real force. And when momentum disappears, the path of least resistance tends to shift lower. Weak structure beneath the surface While the long/short ratio shows balance, other signals point to growing weakness. Bitcoin has repeatedly failed to hold above key resistance near the $72,000 level. Each rejection at that zone reinforces the idea that sellers are active and ready. At the same time, recent buyers are already under pressure, as many entered positions at higher prices. When price rises, the traders will most likely sell to break even, something that would cap the upside potential and limit the strength of any rally because even when the market attempts to push higher, it would run into a wall of supply. This creates a cycle where rallies fade quickly, and confidence erodes further. Macro pressure is tilting the scale The neutral long/short ratio becomes even more dangerous when viewed alongside the broader macro environment. Rising geopolitical tensions in the Middle East and Europe and disruptions in energy markets are pushing inflation concerns back into focus. Notably, higher inflation reduces the likelihood of lower interest rates, And higher rates tend to drain liquidity from risk assets like cryptocurrencies , causing the assets to underperform. This means that even a balanced derivatives market is not truly neutral; it is leaning against a growing macro headwind. Why bulls should be concerned A balanced long/short ratio often gives the impression that the market is stable. But stability without direction is rarely sustainable. When both sides are equally positioned, it does not take much to tip the balance. A small move downward can trigger liquidations on long positions, and those liquidations would push Bitcoin's price even lower towards the next support identified at $63,613 , creating a chain reaction and turning the neutral market into a bearish market. The lack of a strong bullish majority means there is no cushion to absorb selling pressure. And without that cushion, downside moves can accelerate quickly. The post Why a neutral Bitcoin long/short ratio is bad news for bulls appeared first on Invezz
27 Mar 2026, 08:02
ETC Technical Analysis March 27, 2026: Support and Resistance Levels and Market Commentary

ETC at 8.20 dollars under downtrend pressure, critical supports at 7.87 and 8.14 are being monitored. RSI neutral, although MACD gives a bull signal, BTC correlation draws a cautious outlook.
27 Mar 2026, 08:02
Bitcoin ETFs in the US See Highest Outflows as Demand Loses Momentum

US spot bitcoin ETFs have seen their biggest one-day outflow in recent weeks. Institutional demand is cooling as investor caution rises in the crypto sector. Continue Reading: Bitcoin ETFs in the US See Highest Outflows as Demand Loses Momentum The post Bitcoin ETFs in the US See Highest Outflows as Demand Loses Momentum appeared first on COINTURK NEWS .
27 Mar 2026, 08:02
They Call this XRP Rally to $91 a Glitch But This Analyst Says It’s a Preview

A brief but extreme XRP price move on the Kraken exchange has returned to discussion months after it occurred. The move pushed XRP to $91.62 for a moment before the price quickly returned to normal levels. XRP now trades at $1.41, but the event remains part of the asset’s recorded market history and continues to be referenced in discussions about long-term price potential. Crypto analyst XRP Update (@XrpUdate) shared the Kraken chart showing the spike. He wrote, “They’ll call it a ‘Glitch’… I call it a preview.” The chart shows XRP on Kraken reaching a high of $91.62990 during the event. The move took place on November 19, 2025 , drawing attention across the market. $XRP PRINTED $91 ON KRAKEN They’ll call it a “Glitch”… I call it a preview pic.twitter.com/3ZIcRPSfmn — XRP Update (@XrpUdate) March 25, 2026 Why the $91 Print Still Gets Attention The reason this event still gets attention is that it shows how price can move when liquidity is limited, and orders move through the order book quickly. Even though the price did not stay at $91, the move happened on a live exchange and is part of XRP’s real trading data. XRP has shown multiple glitches in the past, and many analysts view these moves as a sign of how its price can react in a market where supply becomes tight and demand increases quickly. In markets with deeper liquidity, these moves are usually controlled over a longer period rather than in a single spike. What Could Help XRP Reach Higher Prices? Several developments could support higher XRP prices over time. Regulatory clarity in the U.S. remains an important factor for institutional participation. As clearer rules emerge, more financial firms can enter the market with defined compliance requirements. Institutional use of the XRP Ledger continues to expand through tokenized assets, stablecoins, and lending systems built on the network. This type of financial activity can increase demand for XRP as a bridge asset within the system. We are on X, follow us to connect with us :- @TimesTabloid1 — TimesTabloid (@TimesTabloid1) June 15, 2025 Global payments remain another area of growth. XRP is designed for cross-border transfers, where speed and cost matter. Increased usage in payment corridors can contribute to long-term demand growth. As more capital flows into the ecosystem, significantly higher price levels become more achievable over time. The Relevance of the $91 Spike The $91 XRP rally on Kraken was brief. XRP Update presented the chart again to show what he believes could represent future price potential rather than a random move. XRP trades at $1.41 today, far below that level, but the current market setup suggests that the asset is on the verge of a major breakout . Disclaimer : This content is meant to inform and should not be considered financial advice. The views expressed in this article may include the author’s personal opinions and do not represent Times Tabloid’s opinion. Readers are advised to conduct thorough research before making any investment decisions. Any action taken by the reader is strictly at their own risk. Times Tabloid is not responsible for any financial losses. Follow us on X , Facebook , Telegram , and Google News The post They Call this XRP Rally to $91 a Glitch But This Analyst Says It’s a Preview appeared first on Times Tabloid .
27 Mar 2026, 08:00
Dogecoin Bottom Not In? Analyst Warns DOGE’s Macro Downtrend Won’t Be Over Soon

As Dogecoin (DOGE) retests a key multi-year support, some analysts predict a bearish outlook for the largest memecoin by market capitalization, warning that its bottom may not be in yet. Related Reading: Bitwise CIO Projects Circle To Hit $75B Valuation By 2030 Despite Selloff, Clarity Act Concerns Dogecoin Targets Lower Levels On Thursday, Dogecoin erased most of its early-week bounce and retested the $0.090 area once again. Market observer Rekt Capital highlighted DOGE’s recent performance, warning that its price correction may not be over yet. As he explained, the leading memecoin lost its multi-year macro uptrend back in November, when it closed the month below its ascending support that had held since early 2023. Therefore, Dogecoin officially confirmed its macro downtrend, which started developing after its cycle peak of $0.484 during the late 2024 bull run. The analyst noted that historically, the cryptocurrency has not retested the macro downtrend line until the price is ready to break it and post-breakout retest it. Based on this, he warned that the memecoin is “unlikely to test this Macro Downtrend anytime soon.” At the moment, DOGE is sitting at its range low, which is also a key reaction zone that previously acted as resistance before turning into support in 2024. According to Rekt Capital, previous bear market performance suggests that Dogecoin will likely lose the current area as support over time, but noted that the price could see a rebound as part of a range-bound cluster in the meantime. If history is any indicator, then price would likely fall well short of the Macro Downtrend and instead reject from the Range High resistance (red region). Perhaps even upside wicking beyond it, but still falling substantially short of the downtrend itself. The analyst concluded that a short-term relief rally remains possible as long as the current level holds, but cautioned that it may be lost in the coming months before bottoming at significantly lower levels. The Case For DOGE’s Price Despite the bearish forecast, other market watchers have shared a more optimistic outlook for the memecoin. Analyst Trader Tardigrade recently signaled that Dogecoin may have reached its bottom already and could be preparing for its next bull run. Per the chart, the cryptocurrency is retesting a historical support for the third time. This trendline has held for roughly a decade, and its retests have previously preceded major price rallies. The first touch in 2017 led to an explosive rally toward its 2018 $0.017 all-time high (ATH), while the second retest in 2021 was followed by a massive surge toward its current ATH of $0.731. Now, Dogecoin is testing this area again and could begin recovering in the short- to mid-term before a massive price expansion to new highs in the mid- to long-term, if it follows its past performances. Similarly, the analyst has also argued that DOGE’s macro structure remains intact, regardless of short-term price action. Last week, he affirmed that the memecoin’s performance during each of its ATH rallies “tells the same story—because Doge makes its own rules.” Related Reading: Cardano Price At Multi-Year Support That Previously Led To 200% Rally – ADA Recovery Ahead? He highlighted that the cryptocurrency currently resembles its past ATH performances, nearing the end of the falling wedge pattern that has preceded significant price expansion to new highs during previous rallies. As a result, he considers Dogecoin to be at a “prime accumulation window” before it potentially goes to the moon. Featured Image from Unsplash.com, Chart from TradingView.com


