


News
20 Apr 2026, 13:44
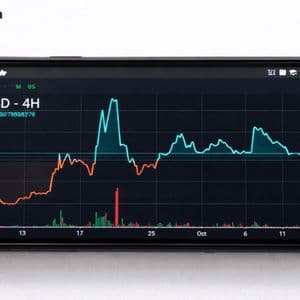
Ethereum drops below $2,290 support, sets up bearish outlook

🔻 Ethereum loses key channel support, drops under $2,290. Bulls failed to push $ETH above resistance as sellers took control. Continue Reading: Ethereum drops below $2,290 support, sets up bearish outlook The post Ethereum drops below $2,290 support, sets up bearish outlook appeared first on COINTURK NEWS .
20 Apr 2026, 13:40
BLOK: Still Diversified, But Bitcoin Now Matters - And That's A Risk

Summary Amplify Blockchain Technology ETF is downgraded to Hold due to increased bitcoin exposure and lack of near-term catalysts. BLOK’s Bitcoin-linked exposure has risen from ~30% to ~40%, reducing its previous diversification edge and increasing reliance on crypto market direction. AI and infrastructure diversification remain, but growth levers in these segments appear saturated and rangebound, limiting upside potential. The portfolio now includes more idiosyncratic bets, slightly muddying thematic purity, while low stock concentration and multi-engine models still offer relative stability. Since my Buy call on the Amplify Blockchain Technology ETF ( BLOK ) in November last year , the ETF has corrected further by ~11%. It has not lived up to the high growth positioning I had expected, but it did live up to the lower heartburn proposition. At a time when Bitcoin corrected further by ~18%, BLOK's lower Bitcoin-linked exposure has meant the drawdown has been far less disruptive, an outperformance only bettered by DAPP (compared below with some of BLOK's direct peer blockchain-themed ETFs). Data by YCharts While BLOK has defended better so far (and that was expected given its structural makeup), some of its structural advantages are waning—most importantly, the Bitcoin-linked exposure has increased. AI infrastructure diversification remains intact, but that trade is going through its own rangebound outlook, limiting its role as a cushion against further falls in Bitcoin prices, not a growth diversification as it was last year. Additionally, some current holdings are now looking more idiosyncratic and difficult to underwrite as part of a broader crypto-themed portfolio. BLOK seems less prepared for the road ahead, especially for further corrections in crypto and related stocks, while Bitcoin's own thesis seems to lack any immediate rerating trigger (beyond the fact that it has corrected significantly from the 2025 top and started a rebound journey). I therefore think BLOK should be downgraded to a Hold now—either a more Bitcoin-proof positioning or a bullish Bitcoin thesis will be required for reigniting interest. Changes Versus November 2025 The biggest change to BLOK's portfolio from November is the Bitcoin-linked exposure level. While it was ~30% at the time of my earlier thesis (and one of the reasons behind its risk-adjusted Buy call), the current loading looks closer to ~40% (based on my assessment from the full holdings downloaded from the ETF website). Top 10 Holdings - BLOK (BOCK Website, November BLOK thesis) We have more miners in the mix now and also some more direct Bitcoin exposure through ETFs (ARKB, HODL) and MSTR. This is not a sea change, but still a significant change toward a higher and more direct crypto beta. The positioning is likely a reflection of higher odds of a Bitcoin rebound after a material round of corrections, but it reduces the ability to outperform if Bitcoin remains flat or sees further corrections. Elsewhere in the portfolio, the AI and infrastructure positioning looks similar by weight but has broadened beyond Nvidia and AMD into Broadcom, TSMC, and Applied Digital. In enterprise software, we now have Dell alongside IBM, which was a prominent part of the earlier enterprise tech portfolio. This diversification is more likely to cushion falls specifically in Bitcoin, but does not retain the same steam for growth it did in 2025. In fact, the going has been rangebound in this part of the portfolio even from the time of writing the November thesis. Capex cycle uncertainties, peak cycle caution, and high valuations here at least restrict runaway rallies from here on (again, the rebound from the Middle East tensions has been sharp, but has not significantly rallied beyond pre-Iran tensions levels). Even if earnings remain strong, valuations may contract a bit to digest earnings gains—leading to a flat outlook at best until the next leg of cyclical strength emerges. I also see more idiosyncratic active bets in BLOK now (such as Bed Bath & Beyond, Opera, FIGR, SBET, etc.) that reduce BLOK's thematic purity and muddle its cleaner crypto thesis earlier—although weights here are not concerning. The exchange and financials layer remains the most stable part of the portfolio—no structural changes here. The net effect of these changes means the diversification edge has weakened in favor of higher Bitcoin reliance. Some optionality introduced by the AI names is now looking saturated. Why BLOK Becomes a Hold Since the Bitcoin exposure has increased, the outlook for Bitcoin becomes important to shape BLOK's rating from here. The fall in Bitcoin is not a catalyst for a rebound. The ~35% fall from the October 2025 top may look massive, but Bitcoin corrected by over 80% not so long ago (in 2022). So the outlook for Bitcoin is not necessarily dictated by its fall from recent highs—although 2025-26 is a regime that has been more supportive in terms of legislation worldwide that addresses adoption, structural and regulatory clarity, custody frameworks, and market access. Data by YCharts Data by YCharts The onus of calling a bottom in Bitcoin prices is on far more important factors like broader liquidity. While rates are not structurally as big a hurdle as they were in 2022, it is now looking like they will stay higher for longer (especially if energy-linked inflation persists). The easing cycle has not been broad and sharp enough across central banks. We are also talking about stagflation worries in the US, which means slower growth and higher rates will imply even lower liquidity overall. The pause in Middle East tensions and the opening of the Strait of Hormuz do ease the pressures on rates and inflation, but the situation needs to be watched before a high-conviction path ahead can be modeled. Spot ETFs are now a more structural source of demand too; that helps. ETF flows have not been encouraging in 2026 so far, with a broader risk-off sentiment dominating growth equity and more so in the case of Bitcoin (even after the rebound from the March 2026 lows). The AUM-to-price ratio chart for IBIT below shows that demand intensity has not really picked up ever since corrections started in Bitcoin around October last year. Data by YCharts Since I do not have a bullish thesis on Bitcoin overall, looking at the liquidity and risk-off environment and ETF flows, a higher allocation to Bitcoin-linked exposure in BLOK is not a positive development for its thesis. Which is why I downgrade it to a Hold . Some of BLOK's core strengths are still intact, though, only that growth levers look dry, and there is no immediate catalyst in sight that calls for an absolute Buy thesis anymore. The relative Buy thesis could still work, though. BLOK is still very much a multi-engine growth model, where a combination of crypto, exchanges, fintech, and AI exposure means multiple sources of growth. And the crypto exposure is still not a dominant returns driver. Despite the increase in crypto exposure, the diversification is not completely done away with. A change from ~30% to ~40% is material, but does not alter the core structure. I also like the low stock level concentration for a portfolio that has 50-60 stocks—the top holdings do not command super high weights beyond 4-5%. The structural strength remains, but the lack of high conviction growth triggers and tweaks in holdings suggests that upside from here is likely to be more dependent on broader macro and crypto conditions rather than internal alpha generation. This reduces the asymmetry that previously favored outperformance, making the case more balanced rather than decisively bullish.
20 Apr 2026, 13:32
CoinDesk 20 performance update: AAVE price plummets 22.9% over weekend

Bitcoin (BTC) price dropped 2.5% and BNB Token (BNB) fell 2.3% from Friday.
20 Apr 2026, 13:32
ZachXBT Flags Kraken as Key Venue in M Token Manipulation, Cites $6B Cap Against $66M in App Volume
Onchain investigator ZachXBT has named Kraken as a key enabler of M token manipulation, citing a $6 billion market cap backed by just $66 million in native app volume and insider wallets controlling more than 90% of supply. Key Takeaways: Kraken joined Bitget and Binance on April 20 in ZachXBT’s expanding M token manipulation probe.
20 Apr 2026, 13:31
Expert: $100 XRP Price Will Happen In 2026 If All These Dominoes Fall

Crypto enthusiast Pumpius has presented an ambitious outlook for XRP, stating that it could reach $100 in 2026 if a series of critical developments align. The post frames this projection as conditional rather than guaranteed, emphasizing that several major structural, regulatory, and market-driven factors must occur simultaneously for such a valuation to materialize. Pumpius positions the forecast beyond modest price expectations, asserting that the discussion should not center on single-digit or even low double-digit price targets. Instead, the argument focuses on a scenario in which XRP achieves a valuation that alters its historical price trajectory and role within global finance. $100 XRP IN 2026 IS IMMINENT — IF THESE DOMINOES ALL FALL!!! If ALL these things go through in 2026, we’re not talking $5 or $10… we’re talking triple-digit XRP that rewrites financial history. The MUST-HAPPEN list for $100 XRP: 1Massive global adoption of Ripple’s… — Pumpius (@pumpius) April 18, 2026 Institutional Adoption and Liquidity Expansion as Core Drivers According to the post, one of the most important requirements for a $100 XRP valuation is widespread global adoption of On-Demand Liquidity. Pumpius claims that financial institutions, including banks and payment providers, would need to process substantial cross-border transactions through the XRP Ledger. This would, in turn, increase demand for XRP while reducing supply through transaction-related mechanisms. The post also highlights the potential impact of exchange-traded funds tied to XRP . Pumpius states that large-scale inflows into spot XRP ETFs, particularly at levels reaching billions of dollars weekly, could position XRP alongside major institutional assets. This level of capital inflow is necessary to support sustained upward price pressure. Regulatory Clarity and Expanding Use Cases Another key condition identified in the post is the establishment of clear and supportive regulatory frameworks. Pumpius references the need for legislation such as the CLARITY Act and broader international alignment, categorizing XRP as a non-security or commodity. The post suggests that this clarity would encourage institutional participation and accelerate comparable partnerships on a scale to established global financial networks. In addition, the post points to the growing relevance of tokenization on the XRP Ledger. Pumpius argues that the introduction of real-world assets, stablecoins, and tokenized financial instruments could significantly expand XRP’s utility. Increased usage across these sectors is presented as a factor that would contribute to both demand growth and supply constraints. Supply Dynamics and Market Conditions The post also emphasizes the importance of a tightening supply environment. Pumpius notes that large holders securing significant portions of XRP, combined with reduced exchange liquidity and potential changes in escrow release patterns, could create conditions for a supply shock . Such a development, according to the post, would amplify price movements during periods of high demand. We are on X, follow us to connect with us :- @TimesTabloid1 — TimesTabloid (@TimesTabloid1) June 15, 2025 Finally, Pumpius links the $100 projection to broader market conditions. The post states that a strong bull market cycle, led by Bitcoin reaching new all-time highs and increased global liquidity, would be necessary. Within this environment, XRP is described as emerging as a dominant bridge asset in cross-border finance. Conditional Outlook with High Expectations Pumpius concludes by noting that even partial alignment of these factors could drive significant price appreciation. However, the $100 target remains tied to the full realization of multiple large-scale developments occurring within a relatively short timeframe. Disclaimer : This content is meant to inform and should not be considered financial advice. The views expressed in this article may include the author’s personal opinions and do not represent Times Tabloid’s opinion. Readers are advised to conduct thorough research before making any investment decisions. Any action taken by the reader is strictly at their own risk. Times Tabloid is not responsible for any financial losses. Follow us on X , Facebook , Telegram , and Google News The post Expert: $100 XRP Price Will Happen In 2026 If All These Dominoes Fall appeared first on Times Tabloid .
20 Apr 2026, 13:30
Strategy makes biggest BTC purchase since November 2024 for $2.54B

Strategy added 34,164 BTC to its treasury, its biggest purchase to date, and the biggest since November 2024. This time, Strategy extended its new fundraising cycle, achieving high demand for its STRC preferred stock. Strategy achieved its goal of purchasing more BTC at scale through a new fundraising cycle. The company now holds 815,061 BTC with an average price of $75,527 BTC. New BTC purchases accelerated as Strategy’s treasury broke even on average. Strategy has acquired 34,164 BTC for ~$2.54 billion at ~$74,395 per bitcoin and has achieved BTC Yield of 9.5% YTD 2026. As of 4/19/2026, we hodl 815,061 $BTC acquired for ~$61.56 billion at ~$75,527 per bitcoin. $MSTR $STRC https://t.co/NYkkvObeb4 — Strategy (@Strategy) April 20, 2026 The recent purchase was expected after Michael Saylor’s preliminary message , which signaled another large-scale addition. The latest purchase arrived as BTC traded above $75,000, though stalling its recent rally at $78,000. Strategy’s move arrives at a time when ETFs and other whales are also accumulating, in expectation of a breakout or long-term growth. Strategy achieves STRC goal Last week’s large purchase revealed the growing demand for STRC, as well as new MSTR issues. The strong STRC demand hinged on April’s ex-dividend date, which usually causes a rush to buy the preferred stock and secure the monthly return of 11.5%. For its latest purchase, Strategy sold 21.7M STRC valued at $2.17B, and an additional 2.16M in new MSTR shares, valued at $366M. STRC achieved $2.17B in volume as of April 14, with a total of $2.2B in proceeds for last week. Currently, STRC trades at $99.36, $0.64 below the ATM rate for new sales. The success of STRC has sparked hopes of another BTC price cycle, this time fueled by digital credit. Starting July 2026, STRC will pay its 11.5% annual dividend bi-weekly , to avoid the crowded sales and spread out raises more evenly, without a big monthly bump in trading. Strategy also aims for less price volatility around ex-dividend dates. MSTR gets a boost from increased demand MSTR has returned to its trading pattern of amplifying the BTC price moves. The common stock was not affected by the ongoing dilution and added over 31% to its price in the past week. MSTR expanded in the past week, amplifying the BTC recovery. | Source: Google Finance MSTR is used as a supporting source of liquidity together with STRC. The common stock expanded to $166.52, securing the recent purchase and enough liquidity for dividend payments. For now, MSTR looks secondary, but Strategy has authorized another $21M. The ATM facility has $26B in new stock issuance, accelerating the Strategy playbook from its previous plans. Your bank is using your money. You’re getting the scraps. Watch our free video on becoming your own bank


