


News
20 Apr 2026, 10:51
Bitcoin drops from recent highs as traders watch CME gap, DeFi hack fallout
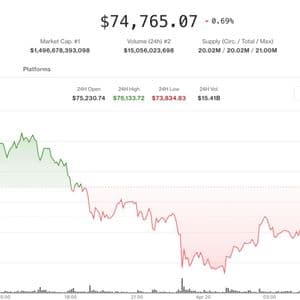
Bitcoin pulled back after Friday’s surge as traders considered a CME futures gap, a DeFi exploit rattled altcoins and macro pressures weighed on sentiment.
20 Apr 2026, 10:50
KelpDAO hack pushes April crypto losses past $606 million

With less than two weeks remaining in April, the crypto industry appears set to record its highest monthly hack losses since February 2025, following the KelpDAO exploit over the weekend. By April 20, hackers had stolen about $606,215,950 from the crypto industry, according to data from DeFiLlama analyzed by Finbold. On April 18, attackers targeted KelpDAO, an Ethereum ( ETH )-based liquid restaking protocol, and drained approximately $293 million. The monthly total value hacked. Source: DeFiLlama At the beginning of this month, Drift Trade – an open source perpetual futures exchange on the Solana ( SOL ) network – was siphoned of around $286 million. As such, crypto losses from hacks surged 1,368% month over month (MoM), reaching a new record in 14 months. Crypto investors flee DeFi space after KelpDAO attack Following the heightened risk of sophisticated attacks on Decentralized Finance (DeFi) in April, crypto investors have been exiting en masse. Over the past 24 hours, all the top 20 DeFi chains registered net outflows of over $10 billion in total value locked (TVL). Precisely, the total TVL in DeFi declined from $99.49 billion on April 18 to hover roughly $85.41 billion, based on metrics from DeFiLlama . TVL changes from the top DeFi chains. Source: DeFiLlama The Ethereum network was the worst hit after the KelpDAO attack, with its TVL declining by $10.34 billion to approximately $46.16 billion at press time. Furthermore, the TVL on AAVE ( AAVE ), a top multi-chain lending protocol, fell to its lowest level in 2026 at reporting time, to about $17.51 billion, down from $26.39 billion on April 18, as indicated on DeFiLlama . TVL on the AAVE protocol. Source: DeFiLlama Web3 expert warns of a systemic risk The attack on Kelp DAO could spread across numerous DeFi protocols, as per analysis from David Schwartz, former Chief Technology Officer (CTO) at Ripple Labs. Furthermore, he noted that several DeFi protocols might be using security shortcuts to catapult the adoption rate. If the DeFi space fails to implement stronger security measures, more hacks and funds loss in the near term could make this month the worst. Furthermore, security experts believe that North Korea-linked group TraderTraitor, which is a subset of the Lazarus Group, may be the bad actor stealing crypto users’ funds. The post KelpDAO hack pushes April crypto losses past $606 million appeared first on Finbold .
20 Apr 2026, 10:50
BTC Spot CVD Chart Reveals Critical Support and Resistance Levels for April 20 Trading Session

BitcoinWorld BTC Spot CVD Chart Reveals Critical Support and Resistance Levels for April 20 Trading Session Market analysts closely examined the BTC spot Cumulative Volume Delta (CVD) chart for 10 a.m. UTC on April 20, 2025, identifying crucial trading levels and institutional order flow patterns in the BTC/USDT pair. This detailed snapshot provides traders with actionable insights into potential support and resistance zones based on real-time order book data from major cryptocurrency exchanges. Decoding the BTC Spot CVD Chart Structure The BTC spot CVD chart serves as a powerful analytical tool for understanding market microstructure. Consequently, traders utilize this data to gauge buying and selling pressure at specific price points. The chart typically divides into two primary sections: the Volume Heatmap and the Cumulative Volume Delta indicator . Each component offers distinct insights into market behavior and potential price movements. Exchange data from April 20 shows the BTC/USDT pair trading within a defined range during the morning UTC session. Market participants actively monitored these levels for breakout or reversal signals. The volume heatmap, in particular, highlighted areas of concentrated trading activity that often precede significant price movements. Understanding the Volume Heatmap’s Predictive Power The Volume Heatmap tracks trading volume at precise price levels across the order book. When the price consolidates within a specific range for an extended period, the background color intensifies. These brighter zones on the chart represent high-volume nodes where significant numbers of transactions have occurred. Market technicians recognize these illuminated areas as potential support or resistance levels . For instance, a bright zone below the current price may indicate strong buying interest that could prevent further declines. Conversely, a bright zone above the current price might represent selling pressure that could cap upward movements. The April 20 chart revealed several such zones that traders monitored throughout the trading session. Analyzing the Cumulative Volume Delta Indicator The Cumulative Volume Delta (CVD) provides a nuanced view of order flow by categorizing trades based on size. This indicator calculates the difference between buying and selling volumes over time, creating a running total that visualizes net order flow. As buy orders dominate, the CVD line trends upward, while selling pressure drives the line downward. The April 20 chart displayed two distinct CVD lines representing different order sizes: Yellow Line ($100-$1,000 orders): This line tracks retail and smaller institutional activity, often showing more frequent fluctuations that reflect shorter-term trading sentiment. Brown Line ($1M-$10M orders): This line monitors large institutional orders that typically indicate strategic positioning by whales, funds, or corporate entities. Divergences between these lines can signal important market dynamics. For example, when the brown line rises while the yellow line falls, institutions may be accumulating positions against retail selling pressure. Historical Context and Market Significance CVD analysis has become increasingly important since 2023 as cryptocurrency markets matured and institutional participation grew. Regulatory developments, including clearer frameworks in major jurisdictions, have encouraged more sophisticated trading approaches. The April 20 analysis follows established methodologies used by traditional finance professionals adapting to digital asset markets. Historical data shows that CVD patterns often precede significant price movements. A sustained rise in the CVD, particularly in the large order category, frequently correlates with upcoming bullish trends. Conversely, a declining CVD with increasing volume may signal distribution phases where large holders are reducing positions. Practical Applications for Traders and Analysts Traders utilize CVD charts for multiple strategic purposes. First, they identify potential reversal zones where CVD extremes coincide with key support or resistance levels. Second, they monitor divergences between price action and CVD trends for early warning signals. Third, they assess the sustainability of price movements by analyzing whether volume confirms the trend direction. The following table illustrates common CVD patterns and their typical interpretations: CVD Pattern Price Action Common Interpretation Rising CVD Consolidation Accumulation phase Falling CVD Rising prices Potential divergence warning Flat CVD Sideways movement Balance between buyers/sellers Spike in Brown Line Breakout Institutional participation On April 20, analysts noted specific patterns that suggested particular market conditions. The relationship between the heatmap zones and CVD trends provided clues about where the market might find equilibrium or experience volatility. Technical Methodology and Data Sources The CVD calculation aggregates data from multiple cryptocurrency exchanges to provide a comprehensive view of the BTC/USDT market. Data providers typically sample order book information at high frequencies, sometimes multiple times per second, to ensure accuracy. The resulting charts represent smoothed aggregates that filter out noise while preserving significant market signals. Industry standards have evolved since 2024, with most professional platforms now offering CVD indicators alongside traditional technical analysis tools. The methodology involves: Collecting real-time trade data from major liquidity pools Categorizing orders by size based on exchange-reported values Calculating net volume differences at each price level Applying time-based smoothing to reduce market noise Visualizing results through color-coded heatmaps and trend lines This approach allows traders to see beyond simple price charts and understand the underlying order flow dynamics driving market movements. Comparative Analysis with Traditional Markets While CVD analysis originated in traditional equity and futures markets, cryptocurrency applications present unique characteristics. Digital asset markets operate 24/7 with global participation, creating continuous order flow without traditional market opens or closes. Additionally, cryptocurrency markets often exhibit higher volatility and different liquidity profiles compared to established financial instruments. Despite these differences, the fundamental principles of order book analysis remain consistent. Large orders leave detectable footprints regardless of asset class. The April 20 BTC spot CVD chart demonstrated patterns recognizable to traders across multiple asset classes, suggesting increasing market maturity. Risk Considerations and Limitations While valuable, CVD analysis has specific limitations that traders must acknowledge. First, the indicator represents historical data and doesn’t guarantee future performance. Second, unusual market events or liquidity shocks can create misleading signals. Third, different exchanges may report data with slight variations in timing or classification. Professional traders typically combine CVD analysis with other indicators and fundamental research. They also consider broader market context, including macroeconomic factors, regulatory developments, and sector-specific news that might influence Bitcoin’s price trajectory beyond technical patterns visible in order book data. Conclusion The BTC spot CVD chart for 10 a.m. UTC on April 20 provided valuable insights into market structure and potential future price movements. The volume heatmap identified key support and resistance zones, while the Cumulative Volume Delta indicator revealed order flow dynamics across different trade sizes. Together, these tools help traders make more informed decisions by visualizing the underlying forces driving Bitcoin’s price action. As cryptocurrency markets continue evolving, sophisticated analysis techniques like CVD chart examination will remain essential for participants seeking to navigate volatility and identify opportunities in the BTC/USDT pair and other digital asset markets. FAQs Q1: What does the BTC spot CVD chart measure? The chart measures order flow imbalance in the BTC/USDT trading pair by calculating the difference between buying and selling volumes over time, while also showing trading concentration at specific price levels through a volume heatmap. Q2: How can traders use the volume heatmap for decision making? Traders identify brighter areas on the heatmap as potential support or resistance zones where significant trading activity has occurred, helping them set entry points, stop-loss orders, and profit targets based on historical volume concentrations. Q3: What is the significance of different colored lines on the CVD indicator? Different colors represent different order sizes, allowing traders to distinguish between retail activity (typically smaller orders) and institutional activity (larger orders), providing insight into which market segment is driving price movements. Q4: How does CVD analysis differ from traditional volume indicators? Unlike simple volume indicators that show total trading activity, CVD analysis categorizes volume by trade direction (buy vs. sell) and size, providing more nuanced information about order flow dynamics and market participant behavior. Q5: Are there specific times when CVD analysis is most valuable? CVD analysis proves particularly valuable during periods of high volatility, near key technical levels, or when divergences appear between price action and order flow, potentially signaling upcoming trend changes or continuations. This post BTC Spot CVD Chart Reveals Critical Support and Resistance Levels for April 20 Trading Session first appeared on BitcoinWorld .
20 Apr 2026, 10:45
‘Significantly accelerated by AI’ – Vercel breach adds to April’s crypto attack wave

How API keys of multiple Vercel customers led to the compromise of Vercel's environment variables marked as “sensitive.”
20 Apr 2026, 10:40
Kelp DAO Hack Traced to Lazarus Group: Report

Attackers allegedly poisoned RPC nodes and exploited Kelp DAO’s single-verifier 1/1 DVN bridge setup to approve a fraudulent cross-chain message. Separately, Ethereum Name Service gateway eth.limo said its recent domain hijacking was caused by a social engineering attack against provider easyDNS, where an attacker impersonated a team member to gain account access and alter DNS settings. Lazarus Group Strokes Again… LayerZero released its preliminary findings on the recent Kelp DAO exploit. It attributed the attack to what it describes as a highly sophisticated state-backed threat actor, likely North Korea’s Lazarus Group, specifically the subgroup known as TraderTraitor. The incident took place on April 18, when Kelp DAO’s LayerZero-powered cross-chain bridge was compromised. This resulted in the loss of 116,500 rsETH tokens worth approximately $292 million. So far, this was the largest decentralized finance exploit this year. X post from LayerZero According to LayerZero, the attackers gained access to the list of RPC nodes used by LayerZero Labs’ decentralized verifier network (DVN), a system of independent entities responsible for validating cross-chain messages. Two of those nodes were allegedly poisoned, which allowed them to transmit a fraudulent message to the DVN. At the same time, the attackers launched a distributed denial-of-service attack against uncompromised nodes, increasing the likelihood that the network would rely on the malicious nodes. The forged message was ultimately accepted because Kelp DAO configured its bridge to use a single 1-of-1 DVN setup This means that there was no secondary verifier in place to detect or reject the fraudulent transaction. LayerZero said this lack of redundancy created a single point of failure. Interestingly, LayerZero previously advised Kelp DAO to diversify its DVN configuration. Despite those recommendations, Kelp DAO chose to continue operating with the 1/1 model. LayerZero explained that the exploit is isolated to Kelp DAO and has not affected other assets or applications using its infrastructure. It said the LayerZero Labs DVN remains fully operational and that projects using multi-DVN security setups can continue operations with confidence. In response to the incident, LayerZero announced that it will no longer sign messages for applications using a 1/1 DVN configuration. The company also said it is cooperating with multiple law enforcement agencies and actively tracking the stolen funds. eth.limo Hijack Caused by Social Engineering Meanwhile, Ethereum Name Service gateway eth.limo disclosed that the domain hijacking incident on Friday was caused by a social engineering attack targeting its domain service provider, easyDNS. In a postmortem that was published on Saturday, eth.limo explained that an attacker impersonated one of its team members and initiated an account recovery process with easyDNS. That fraudulent recovery request reportedly gave the attacker access to the eth.limo account, which allowed them to modify key domain settings. The attacker then changed the name server records and redirected them to Cloudflare-controlled infrastructure. Once the issue was identified as a DNS hijack, eth.limo said it immediately alerted the community and reached out to Ethereum co-founder Vitalik Buterin. The company also contacted easyDNS to begin coordinating a response. During the incident, Buterin warned users to avoid visiting his personal blog through the affected gateway until the matter was resolved. Eth.limo provides access to roughly two million decentralized websites using the .eth domain name system, which makes it a very important access point for users browsing Ethereum-based sites through standard web browsers. If successfully weaponized, control of the service could have allowed attackers to redirect visitors to phishing pages or malware-laced websites. However, both eth.limo and easyDNS said the Domain Name System Security Extension (DNSSEC) limited the damage. DNSSEC adds cryptographic verification to DNS records, and because the attacker did not possess the required signing keys, they were unable to create valid signatures for forged DNS responses. As a result, many DNS resolvers rejected the manipulated records, causing users to see errors rather than malicious redirects. Eth.limo said the missing signing keys likely reduced the overall impact of the attack and added that it is not currently aware of any user harm. The company said updates would be provided if that assessment changes. EasyDNS CEO Mark Jeftovic publicly accepted responsibility for the incident by stating that the company made mistakes and would own them. He described the breach as the first successful social engineering attack against an easyDNS client in the company’s 28-year history, despite many prior attempts. Following the incident, easyDNS said it already began implementing security changes to prevent similar attacks in the future.
20 Apr 2026, 10:40
Digital Asset Products Achieve Remarkable $1.4 Billion Net Inflow as Institutional Confidence Surges
BitcoinWorld Digital Asset Products Achieve Remarkable $1.4 Billion Net Inflow as Institutional Confidence Surges Digital asset investment products achieved a substantial $1.4 billion net inflow during the week ending April 11, 2025, marking the third consecutive week of positive momentum according to CoinShares’ latest fund flow report. This significant movement demonstrates growing institutional confidence in cryptocurrency markets following recent geopolitical developments. The data reveals clear patterns in investor behavior across different digital assets. Digital Asset Inflows Reach $1.4 Billion Milestone CoinShares, a leading digital asset investment firm, published its weekly fund flow report documenting substantial institutional movement. The $1.4 billion net inflow represents one of the strongest weekly performances in 2025. Furthermore, this marks the third consecutive week of positive inflows, suggesting a sustained trend rather than isolated activity. Institutional investors appear increasingly comfortable allocating capital to cryptocurrency products. Market analysts immediately noted the significance of these figures. The cumulative three-week inflow now exceeds $3.2 billion, reversing previous outflows from earlier in the year. This pattern indicates shifting sentiment among professional investors. Additionally, the scale of these movements suggests substantial capital deployment rather than speculative trading. Bitcoin Dominates Institutional Investment Flows Bitcoin investment products captured the majority of institutional capital, attracting $1.11 billion in net inflows. This represents approximately 79% of the total weekly movement. Bitcoin’s dominance in institutional flows continues a well-established pattern observed throughout 2024 and 2025. The cryptocurrency maintains its position as the primary gateway for traditional finance entering digital assets. Several factors contribute to Bitcoin’s continued appeal. Its established regulatory framework in major markets provides institutional comfort. Moreover, Bitcoin’s relative maturity compared to other digital assets reduces perceived risk. The approval and subsequent success of spot Bitcoin ETFs in the United States created additional infrastructure for institutional participation. Ethereum Captures Significant Secondary Interest Ethereum products recorded $320 million in net inflows, representing the second-largest allocation. This substantial figure demonstrates growing institutional confidence in Ethereum’s ecosystem and upcoming protocol developments. The Ethereum network continues evolving with significant upgrades planned throughout 2025. Institutional interest in Ethereum often correlates with developments in decentralized finance and enterprise blockchain applications. Major financial institutions increasingly explore Ethereum-based solutions for various use cases. Consequently, investment products tracking Ethereum benefit from this broader institutional exploration. Selective Outflows Reveal Investor Caution Not all digital assets experienced positive flows during the reporting period. XRP products recorded $56.2 million in net outflows, while Solana (SOL) products saw $2.3 million leaving. These selective outflows indicate investor discrimination between different cryptocurrency projects. Market participants appear focused on assets with clearer regulatory pathways and established institutional frameworks. The outflows from XRP products continue a pattern observed throughout early 2025. Regulatory uncertainty surrounding certain digital assets influences institutional allocation decisions. Investment managers typically prioritize regulatory clarity when making allocation decisions for client portfolios. Weekly Digital Asset Investment Product Flows Asset Net Flow Percentage of Total Bitcoin (BTC) +$1.11 billion 79.3% Ethereum (ETH) +$320 million 22.9% XRP -$56.2 million -4.0% Solana (SOL) -$2.3 million -0.2% Total +$1.4 billion 100% Geopolitical Developments Influence Risk Appetite CoinShares analysts specifically attributed the inflow trend to improving risk appetite following diplomatic developments. Negotiations to extend the U.S.-Iran ceasefire reduced immediate geopolitical tensions. Consequently, institutional investors demonstrated increased willingness to allocate to risk assets including digital currencies. Historical data shows cryptocurrency markets often respond to macroeconomic and geopolitical developments. Reduced geopolitical tension typically correlates with increased risk appetite across financial markets. Digital assets, as emerging risk assets, particularly benefit from such sentiment shifts. The timing of these inflows aligns closely with diplomatic announcements regarding Middle East negotiations. Institutional Infrastructure Supports Sustained Flows The current inflow pattern benefits from significantly improved institutional infrastructure. Several developments created this supportive environment: Regulatory clarity in major jurisdictions including the United States and European Union Established custody solutions from traditional financial institutions Spot ETF approvals providing familiar investment vehicles Improved market surveillance and compliance tools This infrastructure reduces operational barriers for institutional participation. Consequently, capital movements can occur more efficiently than in previous market cycles. The current inflows reflect both improved sentiment and reduced friction for institutional investors. Comparative Analysis with Previous Inflow Periods The current three-week inflow period shows distinct characteristics compared to historical patterns. Previous institutional inflow surges typically followed specific catalyst events like ETF approvals or major protocol upgrades. The current inflows appear more organic, driven by broader macroeconomic factors rather than single events. Additionally, the composition of flows differs from previous periods. Bitcoin continues dominating, but Ethereum captures a larger percentage than in some previous cycles. This suggests institutional portfolios may be diversifying within the digital asset category rather than concentrating exclusively on Bitcoin. Regional Distribution of Investment Flows While CoinShares’ report highlights global totals, regional patterns provide additional context. The United States typically accounts for the majority of institutional digital asset flows, followed by European markets. Recent regulatory developments in Asia-Pacific regions may influence future flow patterns. Regional regulatory approaches continue evolving, creating varying environments for institutional participation. Jurisdictions with clearer frameworks typically experience more consistent institutional activity. The current global inflow pattern suggests multiple regions contribute simultaneously rather than relying on a single geographic driver. Conclusion Digital asset investment products recorded substantial $1.4 billion net inflows during the reported week, continuing a three-week positive trend. Bitcoin dominated these institutional flows with $1.11 billion, while Ethereum captured significant secondary interest. Selective outflows from XRP and Solana products indicate investor discrimination based on regulatory clarity and institutional readiness. Geopolitical developments, particularly Middle East ceasefire negotiations, contributed to improved risk appetite among institutional investors. The sustained inflow pattern, supported by improved market infrastructure, suggests growing institutional comfort with digital asset allocation. These digital asset inflows provide important signals about institutional sentiment and risk tolerance in evolving financial markets. FAQs Q1: What timeframe does the CoinShares report cover? The report covers digital asset investment product flows for the week ending April 11, 2025, showing net movements during that specific period. Q2: Why did Bitcoin receive most of the institutional inflows? Bitcoin’s established regulatory framework, market maturity, and available investment infrastructure make it the preferred entry point for institutional investors allocating to digital assets. Q3: What caused the outflows from XRP investment products? XRP experienced $56.2 million in net outflows, likely due to ongoing regulatory uncertainty and institutional preference for assets with clearer compliance pathways. Q4: How do geopolitical developments affect cryptocurrency flows? Reduced geopolitical tension, like ceasefire negotiations, typically increases risk appetite across financial markets, benefiting emerging asset classes including digital currencies. Q5: Are these flows primarily from retail or institutional investors? CoinShares specifically tracks investment products typically used by institutional investors, including ETFs, exchange-traded products, and institutional fund vehicles. This post Digital Asset Products Achieve Remarkable $1.4 Billion Net Inflow as Institutional Confidence Surges first appeared on BitcoinWorld .


