


 Invest ideas
News
4 Jun 2026, 13:00
Analyst Calls Out Stagnant Logic Being Used On XRP, Predicts When Price Will Rally To $300

XRP has spent much of 2026 trading below the targets often discussed across its community, but one XRP commentator is saying that projections to these price targets are being viewed through the wrong lens. The analyst claims that XRP should not be measured like a traditional stock, especially if the asset functions as it is designed and it becomes tied to institutional settlement, liquidity routing, and high-value financial transfers. XRP Commentator Says Market Cap Logic Misses The Point Most XRP price discussions are based on market cap comparisons and circulating supply figures, which are the same models used to analyze stocks. However, according to an XRP commentator account known as CharuSan, this is a stagnant market cap logic being applied to XRP since it fundamentally misunderstands what the cryptocurrency was built to do. Related Reading: The Bitcoin Bear Market Is Over: Here’s Where We Are In The Cycle XRP is meant to play as a liquidity and velocity asset; therefore, the cryptocurrency’s price should not rise only because investors are buying it on exchanges. Instead, the projection is that XRP’s price will need to be much pushed higher if institutional systems begin using it as a bridge asset for massive transfers that demand deep liquidity within seconds. Furthermore, CharuSan XRP pointed to the size of global derivatives, stock markets, debt markets, DTCC volumes, FX settlement, banks, OTC markets, and Nostro/Vostro accounts as areas where liquidity demand could come from if they are fully integrated with the XRP Ledger. Therefore, a $500 billion or $1 trillion market cap would still be too small if XRP were expected to support these institutional trading volumes. XRP Needs To Be $300 At Least The price target floated by the analyst is that XRP will be mathematically forced to skyrocket to $300 in order to keep the wheels running. Notably, the $300 prediction is tied to a specific condition of full integration of XRP into major financial transfer systems. Once institutional automated software and APIs begin sending large transfer orders into liquidity pools, the market will no longer be guided mainly by small exchange buy and sell orders. Based on that setup, the main issue would be the amount of available XRP at the exact moment a transfer needs to be completed. If billions of dollars are moving per second, institutions will not search for cheap XRP sitting on a normal order book. The systems would draw from the deepest available liquidity pool, and the unit price would need to rise if available supply cannot support the transfer volume. Related Reading: Pundit Says Dogecoin Is About To Do Something Insane, Here’s What Interestingly, the latest post is part of a series from CharuSan XRP on how XRP could reach $300. In the previous part, he focused more directly on On-Demand Liquidity and the difference between circulating supply and truly available XRP. He gave the example of a $200 billion bank transfer. If XRP were priced at $20, such a transfer would require 10 billion XRP, which would be difficult to support if the system were handling not just one bank but thousands of banks and institutions at the same time. RippleNet currently has over 300 banking partners, and about 40% are actively using On-Demand Liquidity. Featured image created with Dall.E, chart from Tradingview.com
4 Jun 2026, 12:52
Bitcoin Falls Below $63,000 Amid ETF Exodus and Growing Bearish Calls

Bitcoin continued its recent slide, falling below the $63,000 level as bearish sentiment intensified across the cryptocurrency market. The King crypto is now down nearly 7% over the past 24 hours, roughly 15% over the last week, and almost 23% during the past month. At around $62,450, Bitcoin is trading significantly below recent highs and remains under pressure from multiple market headwinds. The latest weakness comes as investors withdraw billions of dollars from spot Bitcoin ETFs while broader financial markets continue favoring artificial intelligence-related investments. Strategy's Bitcoin Sale Sparks Fresh Debate One of the most discussed developments this week involved software company and Bitcoin treasury giant Strategy. The company, led by Michael Saylor, sold approximately 32 BTC worth around $2.5 million. While the transaction represented only a tiny fraction of its more than 843,000 Bitcoin holdings, the move attracted significant attention. Why did such a small sale matter? The answer lies in investor psychology. For years, Strategy's commitment to a ”never sell” Bitcoin strategy became a cornerstone of the bullish narrative surrounding corporate Bitcoin adoption. Several analysts argued that the financial impact of selling 32 BTC is insignificant. However, the symbolic shift raised concerns among investors already nervous about Bitcoin's recent underperformance. ETF Outflows Create Another Major Headwind At the same time, the spot Bitcoin ETF market continues to experience heavy selling pressure. Investors have reportedly withdrawn nearly $4 billion from US-listed Bitcoin ETFs over the last 12 consecutive trading sessions. The streak represents one of the most significant periods of sustained outflows since the products launched. Source: Bloomberg via X ETF flows have become one of Bitcoin's most important demand drivers over the past two years. When money consistently leaves these funds, it removes a key source of buying support. The outflows suggest institutional investors are becoming more cautious as volatility increases and alternative opportunities emerge elsewhere in the market. AI Stocks Are Winning the Capital Rotation Battle Another challenge for Bitcoin is growing competition from the booming artificial intelligence sector. While Bitcoin has struggled, technology stocks have continued making new highs. The Nasdaq-100 has gained strongly over the past year, fueled by aggressive spending on AI infrastructure, semiconductors, and cloud computing. Some portfolio managers believe investors are actively rotating capital out of digital assets and into AI-related equities. The logic is straightforward. Many investors currently see stronger earnings visibility and more predictable growth opportunities in AI companies than in cryptocurrencies, which remain heavily dependent on liquidity conditions and investor sentiment. Is Bitcoin Near a Bottom? Despite the recent weakness, not everyone is turning bearish. Analysts at Standard Chartered believe Bitcoin's selloff may be approaching exhaustion. Geoffrey Kendrick, one of the bank's leading crypto strategists, argued that investors could eventually look back at current levels as an attractive buying zone if ETF outflows stabilize and concerns surrounding Strategy fade. Technical analysts remain divided. Some traders expect Bitcoin to revisit the $52,000 area before establishing a durable bottom. More bearish forecasts suggest a move toward the $40,000-$45,000 range if market conditions continue to deteriorate. Others believe the recent decline represents a liquidity-driven correction within a broader long-term bull cycle. For now, Bitcoin remains caught between powerful opposing forces. On one side are persistent ETF outflows, weakening sentiment, and capital rotation into AI stocks. On the other are growing expectations that institutional demand could eventually return once current market fears subside. More force is leaning bearish. The next few weeks may determine whether Bitcoin is forming a major bottom, or whether another leg lower still lies ahead. A higher timeframe bullish confirmation and momentum would act as a reversal signal in the near term in regards to the listed Key levels.
4 Jun 2026, 12:52
Bitcoin UTXOs in Loss Hit All-Time High: What It Means for the Market

Bitcoin is down over 16% in the past week, falling from a high of around $76k to currently trading at $62k mark. The largest cryptocurrency is now down roughly 50% from its all time high set in October last year. Heavy ETF outflows, bearish headlines from Mt. Gox adding sell side pressure and Strategy’s first BTC sale since 2022 have contributed to most of the damage. This selloff has dragged a huge chunk of the market underwater. Onchain data from CoinGlass shows that the number of Bitcoin UTXOs sitting in loss climbed past 165 million this week on June 2, the highest reading ever recorded. With BTC hovering around the low $60k region, more coins are now held below their cost than at any point in Bitcoin’s history. What “UTXOs in Loss” Actually Tracks A UTXO, short for unspent transaction output, is Bitcoin or sats sitting in a wallet that hasn’t been moved since it was received. Every one carries a price tag, the value of BTC the last time it changed hands. When the spot price of BTC falls below that level, that’s when the UTXO is seen to be at a loss. It does not mean anyone sold or locked in anything. On paper, it just means that the coins are worth less than they cost to get. The 165 million figure means a record slice of the network is holding bags bought at higher levels. While the number of UTXOs in loss is in fact at an all time high, the number itself has a nuance worth unpacking. During the 2022 bear market lows, this number was around the 40 million range. The reason why this figure is so much higher during this correction comes down to the simple reason that the number of UTXOs on the network has shot up dramatically due to exchange activity accelerating and the Ordinals boom over the past four years. This has multiplied the number of separate outputs sitting on chain. More UTXOs exist than ever before, therefore a larger cohort in loss is partly mechanical. A better read on sentiment on this front would therefore be supply in loss. That measure strips out the growth in total outputs and shows how much actual circulating BTC is underwater. When looking at where this data currently sits, over 9.5M BTC of supply is in loss. This, however, is not out of the ordinary and is actually still below the extremes seen in the 2022 and 2019 bear markets. The Line in the Sand to Watch The metric worth tracking now is realized price, currently around $53,500. It’s the aggregate cost basis of every coin on the network, built from the price each one last moved at. In past bear markets it has worked as a floor. In both the previous bear markets, BTC briefly dipped below this level and both times marked a great entry for investors. For now, the broader holder base is in profit. A slide toward $53.5k, which is a further 15% correction from current levels, would be the real test. The gap right now between $62K and the realized price gives bulls breathing room, but 165 million loss-making coins is a loud reminder of how much of the market is staring at that level. The smartest crypto minds already read our newsletter. Want in? Join them .
4 Jun 2026, 12:50
Arthur Hayes-Linked Wallet Deposits $5.7M in HYPE to Bybit, Confirms Full Sale

BitcoinWorld Arthur Hayes-Linked Wallet Deposits $5.7M in HYPE to Bybit, Confirms Full Sale A wallet address linked to BitMEX co-founder Arthur Hayes has deposited 85,714 HYPE tokens, valued at approximately $5.73 million, to the cryptocurrency exchange Bybit over the past three hours. The transactions, identified by blockchain analytics firm Onchain Lens, occurred in three separate batches and are widely interpreted as a precursor to a potential sale. Hayes Confirms Exit from HYPE and NEAR Earlier today, Hayes publicly stated that he had sold all of his holdings in both HYPE and NEAR tokens. He added that he would provide a detailed explanation for his decision next Tuesday. The on-chain activity appears to align with his announcement, reinforcing the signal that a large-scale sell-off is underway. Market Context and Implications Large deposits to centralized exchanges are often viewed by market participants as bearish signals, as they suggest an intent to liquidate. The movement of nearly $6 million worth of HYPE to Bybit could introduce short-term selling pressure on the token. Hayes, a well-known figure in the crypto space, has a history of making bold market calls, and his exit from these positions may influence retail and institutional sentiment. Why This Matters to Investors For holders of HYPE and NEAR, the move by a high-profile investor like Arthur Hayes warrants attention. While his personal trading strategy does not necessarily reflect the broader market outlook, large-scale liquidations by influential figures can trigger volatility. Investors may want to monitor the market reaction and await Hayes’s detailed rationale next week for further clarity. Conclusion The deposit of 85,714 HYPE to Bybit by an Arthur Hayes-linked wallet, combined with his public confirmation of a full sale, represents a significant on-chain event. The market will be watching closely for the impact on HYPE’s price and the reasoning behind Hayes’s decision, which is expected to be disclosed in the coming days. FAQs Q1: Why is Arthur Hayes selling his HYPE and NEAR tokens? A: Hayes has not yet provided a detailed reason, but he announced he sold all his holdings and will explain his reasoning next Tuesday. Market speculation includes profit-taking or a shift in his investment thesis. Q2: How much HYPE was deposited to Bybit? A: A total of 85,714 HYPE tokens, worth approximately $5.73 million, were deposited in three transactions over three hours. Q3: Does this mean the price of HYPE will drop? A: Large deposits to exchanges can indicate an intent to sell, which may create short-term selling pressure. However, market reactions are complex and depend on overall demand and other factors. This post Arthur Hayes-Linked Wallet Deposits $5.7M in HYPE to Bybit, Confirms Full Sale first appeared on BitcoinWorld .
4 Jun 2026, 12:45
How Low Can Bitcoin Price Fall as Crypto Market Liquidations Hit 6-Month High?
Bitcoin’s selloff accelerated as the price broke below key support levels, while leveraged crypto liquidations reached their highest daily level since January 2026. Market data showed about $1.8 billion in leveraged positions liquidated in one day, reflecting forced closures across Bitcoin and altcoin markets. BTC has moved sharply lower after losing the $65,000 monthly EMA50 support level. The move added pressure to a market already dealing with spot Bitcoin ETF outflows, weaker liquidity, rising macro concerns, and capital rotation toward artificial intelligence stocks. Bitget CEO Gracy Chen said Bitcoin’s latest decline should not be viewed only through a bearish lens but argued that the risks cannot be ignored. She pointed to 13 consecutive days of spot Bitcoin ETF net outflows totaling $4.37 billion, the longest continuous outflow streak on record. Bitcoin Loses $65K Support as ETF Outflows Continue Bitcoin’s break below $65,000 placed attention to lower technical levels. Chen said the next key support sits near the 50-month SMA at $59,000, followed by a wider support range between $52,000 and $48,000. Ali Charts also pointed to Bitcoin’s MVRV pricing bands, saying the breakdown below $72,000 left BTC vulnerable. Based on that model, the next major support area sits between $54,000 and $50,000. The decline comes while U.S. equity indexes remain strong. Chen noted that Bitcoin is falling as the S&P 500 and Nasdaq trade at record highs, with institutional capital moving toward AI-related assets rather than crypto. She cited the view that BTC is currently “stuck in the middle,” lacking the strongest safe-haven demand while also trailing high-growth equity themes. She also listed several pressures weighing on Bitcoin, including rising CPI concerns, lower expectations for Federal Reserve rate cuts, continuing ETF outflows, pressure tied to digital asset treasury dividend products, and upcoming IPOs from SpaceX, OpenAI, and Anthropic, which could draw more capital toward public equity markets. Liquidations and Distribution Raise Market Stress The liquidation total of $1.8 billion shows how quickly leveraged positioning unwound as BTC moved lower. Forced selling can increase volatility because traders using borrowed funds are automatically closed out when margin levels fail. CryptoQuant CEO Ki Young Ju described the current phase as a large transfer of Bitcoin ownership. He said Bitcoin investors’ average cost basis is near $53,000 and noted that previous bear markets ended only after the price moved to a realized price below. Source: Cryptoquant Ju pointed to the scale of supply absorbed since the last cycle. Since January 2023, Strategy has bought 711,206 BTC and sold only 32 BTC, removing 711,174 BTC from circulation. Since March 2024, when Bitcoin was also around $63,000, ETFs absorbed 509,102 BTC and Strategy bought 650,706 BTC, for a combined 1,240,808 BTC. That figure is larger than the estimated 1 million BTC held by Satoshi Nakamoto and close to half of exchange reserves, which Ju placed near 2.7 million BTC. He said the return to the same price level despite that absorption points to unusually strong selling pressure. Analyst Watch $59K, $54K and $50K Zones Michaël van de Poppe said Bitcoin has returned to the 200-week moving average for a support test. He noted that this area marked cycle bottoms in 2015, 2018 and 2020, while the market fell below it during the 2022 FTX collapse. Source: X He also said Bitcoin’s daily RSI has reached levels similar to the COVID-19 crash and the February 2026 decline. From his view, the area may be watched by long-term buyers, but continued weakness in Strategy-linked preferred product STRC could keep pressure on BTC. Chen also referenced Strategy’s sale of 32 BTC at around $77,000, noting that the last time Michael Saylor’s company sold Bitcoin in 2022, it occurred near the prior cycle bottom. She said BTC later fell below $62,000, raising the question of whether the market is nearing a local bottom or preparing for another leg lower.
4 Jun 2026, 12:45
Traders Eye $61K as Bitcoin’s Last Defense Before a Drop to the High $50Ks
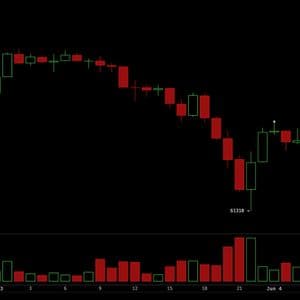
At 8:30 a.m. EDT, bitcoin traded at $63,444 on June 4, 2026, with its relative strength index ( RSI) registering just 17 and all 14 tracked moving averages pointing lower, placing the $61,310 swing low at the center of every active trader’s attention. The technical picture is uniformly bearish across the daily, 4-hour, and 1-hour


