


 Invest ideas
News
4 Jun 2026, 09:12
60M XRP Leaves Whale Hands — Is a Sub-$1 Dip Needed Before a Relief Bounce?

XRP Whales Offload 60 Million Tokens as Bears Target the $0.87–$0.92 Zone XRP is coming under renewed pressure as whale activity and weakening technical signals raise fresh questions about where the market could stabilize next. According to prominent crypto analyst Ali Martinez, data from Santiment shows that roughly 60 million XRP have been sold or redistributed by large holders over the past week. While redistribution does not always indicate outright selling, such movements are closely watched by traders because whale activity often precedes periods of heightened market volatility. Why is this the case? Well, large investors have the ability to influence liquidity and market sentiment, and the latest shift in holdings comes at a time when the broader cryptocurrency market is already experiencing increased selling pressure. As a result, many market participants are questioning whether XRP has reached a local bottom or if further downside remains ahead. XRP Paints a Cautious Picture The broader sentiment across the crypto market has turned more cautious, with XRP now caught in a wider wave of selling pressure. This has fueled debate among investors over whether the asset has already formed a local bottom or still has room to decline further before finding solid support. Market commentator CasiTrades adds to the bearish outlook, suggesting XRP may be entering a key phase of its current correction. Based on Elliott Wave analysis , she points to what appears to be a developing subwave 3 decline, typically one of the sharpest and most aggressive stages in a corrective cycle. She also highlights that XRP has slipped below a major support level that had held for months. Using Fibonacci extension levels, she identifies the $0.92 zone as a critical downside target, closely aligned with the widely watched $0.87 support area that many analysts believe could attract strong buyer interest if tested. In her scenario, XRP could see a swift drop toward $0.92 before staging a temporary relief bounce toward $1.20. However, she notes that caution should not be thrown to the wind because any recovery may face strong resistance, potentially setting up one final retest of lower support near $0.87. Despite the short-term bearish structure, some traders view the pullback as a necessary market reset. Such corrections often help clear excess leverage and speculative positioning, creating conditions for a more sustainable recovery if demand returns at key price levels. Currently, XRP is trading at $1.16 per CoinCodex data, down by 9.18% over the past week. With whale redistribution rising and key support under pressure, XRP sits at a decisive point, where the $0.87–$0.92 zone may ultimately determine whether the next major move is a deeper correction or the foundation for a broader recovery.
4 Jun 2026, 09:08
Why is the Ripple (XRP) Price Down This Week? (June 4)
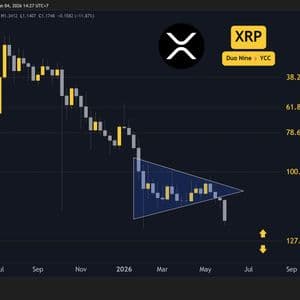
XRP is down 9% on the weekly chart! Can the support at $1 stop the downtrend? Ripple (XRP) Price Predictions: Analysis Key support levels: $1 Key resistance levels: $1.4, $1.6, $2 Downtrend Resumes After three months of XRP moving sideways to form a large pennant, the price finally fell below it. With this latest drop, XRP resumes its downtrend, which is on a collision course with the $1 support level. Unfortunately, buyers have vanished from the order books as crypto assets across the board are in the red this week. XRP is no different and was unable to stop the recent sell pressure. Because of this, lower lows are likely in the future. Source: TradingView Key Support Approaching The most important support level right now is found at $1. This level has not been tested so far this year, and it’s likely to be tested in the near future if this downtrend continues at this pace. For buyers to return, XRP needs to become attractive again. A price around $1 is also a key psychological level that has a good chance of triggering a battle between buyers and sellers. Hopefully, this level will allow for a relief rally once tested. Source: TradingView Bearish Cross on 3-Day MACD Last week, we discussed the bearish cross on the 2-day timeframe. However, since then, the 3-day MACD also did a bearish cross. This reconfirms the downtrend and encourages sellers to take positions expecting new lows. Sellers have been dominating since mid-May when buyers had a last attempt at a breakout. That move turned into a bullish trap, and the price has been going down non-stop since. Source: TradingView The post Why is the Ripple (XRP) Price Down This Week? (June 4) appeared first on CryptoPotato .
4 Jun 2026, 09:05
XRP falls below $1.20 as downside risk grows

🚨 $XRP slid below $1.20, reaching $1.1401 amid market weakness. 📉 Downward signals persist as resistance forms above $1.20. 📊 A potential rebound depends on regaining key technical levels. 🔎 In 2026, deeper correction toward $0.84 may remain possible. Continue Reading: XRP falls below $1.20 as downside risk grows The post XRP falls below $1.20 as downside risk grows appeared first on COINTURK NEWS .
4 Jun 2026, 09:05
Bitcoin Quantum Discount Hits 27%: What's It Means for Smart Investors Today

Charles Edwards warns a 28% quantum discount is suppressing Bitcoin price discovery due to developer inertia.
4 Jun 2026, 09:05
Bitcoin Faces $1.87B in Short Liquidations if Price Breaks Above $67,055

BitcoinWorld Bitcoin Faces $1.87B in Short Liquidations if Price Breaks Above $67,055 Bitcoin’s price is approaching a critical threshold that could trigger a cascade of liquidations across major centralized exchanges. Data from CoinGlass shows that a move above $67,055 would result in the liquidation of approximately $1.87 billion in short positions. Conversely, a drop below $60,027 would lead to the liquidation of $1.02 billion in long positions. Understanding the Liquidation Data The figures, compiled from order books on major centralized exchanges (CEXs), represent the total value of positions that would be forcibly closed if Bitcoin’s price reaches these specific levels. Liquidations occur when a trader’s position moves against them and their margin is insufficient to keep the trade open. A large liquidation event can amplify price movements, creating a feedback loop known as a ‘squeeze.’ In this case, a break above $67,055 would primarily impact short sellers — traders who bet on the price falling. A short squeeze could add upward momentum, potentially pushing prices higher. On the other hand, a drop below $60,027 would trigger long liquidations, which could accelerate a downward move. Market Context and Implications Bitcoin has been trading in a relatively wide range over the past weeks, with these two price levels acting as key support and resistance. The concentration of liquidity at these points makes them particularly significant for traders and market observers. The data from CoinGlass is based on aggregated open interest and liquidation levels from exchanges such as Binance, Bybit, and OKX. It is important to note that liquidation data reflects potential, not guaranteed, outcomes. Market conditions, order book dynamics, and the speed of price movement can influence whether all positions are liquidated at once. However, the sheer size of the potential liquidations — nearly $1.9 billion in shorts alone — underscores the high stakes for leveraged traders. What This Means for Traders For active traders, these levels represent potential areas of heightened volatility. A break above $67,055 could trigger rapid price appreciation as shorts are forced to cover. Conversely, a drop below $60,027 could lead to a sharp sell-off. Risk management becomes crucial around these zones, as the market may react unpredictably. Conclusion The $67,055 and $60,027 levels are now key focal points for Bitcoin traders. The data from CoinGlass highlights the significant leverage built up in the market, and any move beyond these thresholds could have outsized effects. As always, traders should approach these levels with caution, given the potential for rapid and amplified price swings. FAQs Q1: What is a liquidation in cryptocurrency trading? A liquidation occurs when a trader’s leveraged position is forcibly closed by the exchange because the trader’s margin balance has fallen below the required maintenance level. This typically happens when the market moves against the trader’s position. Q2: How does CoinGlass calculate liquidation data? CoinGlass aggregates open interest and liquidation levels from major centralized exchanges using their respective APIs. The data reflects the cumulative value of positions that would be liquidated if the price reaches a specific level. Q3: Can these liquidation levels be guaranteed? No. The data represents potential liquidations based on current open interest and margin levels. Actual liquidations can vary depending on market depth, order book changes, and the speed of price movement. It is a useful indicator but not a precise prediction. This post Bitcoin Faces $1.87B in Short Liquidations if Price Breaks Above $67,055 first appeared on BitcoinWorld .
4 Jun 2026, 09:04
Will XRP Lose $1 in Next 30 Days? Analyzing Fundamental Bearish Shift

XRP might lose the historic threshold way sooner than anticipated.