


 Invest ideas
News
2 Jun 2026, 19:30
Bitcoin Critic Peter Schiff Takes a Jab at BTC As Price Falls Below $67K

Bitcoin price fell below $67,000 as selling pressure deepened across the crypto market, renewing criticism from longtime Bitcoin skeptic Peter Schiff and reviving debate over whether the asset’s latest drawdown reflects a broader market breakdown or another cycle-based correction. BTC had already slipped below $70,000 for the first time since April 7 before extending losses toward the $67,000 area. The move followed a sharp decline from recent highs and came as short-term holders sent more coins to exchanges at a loss, while spot Bitcoin exchange-traded funds continued to record outflows. Schiff argued that Bitcoin’s underperformance from its November 2021 peak compared poorly with other major assets. He said BTC was trading below $69,000, a level first reached nearly five years ago, while the Nasdaq had gained 73%, gold had risen 138% and silver had climbed 218% over the same period. He said investors who bought Bitcoin during that window had missed gains available in both equities and metals. Peter Schiff Targets Bitcoin as Price Weakens Schiff said early Bitcoin investors had made large gains but argued that more recent buyers had faced weaker results. He also said Bitcoin’s chart looked like a large top, adding that the asset could have further downside. His comments drew responses from Bitcoin supporters, who said the comparison used the 2021 cycle peak as a starting point while ignoring Bitcoin’s recovery from the 2022 bear market low near $16,000. Some users noted that BTC had still delivered large gains for investors who bought during lower-stress periods. Source: X Schiff also criticized the possibility of government support for the crypto market. As Bitcoin broke below $67,000, he claimed pressure could build from Trump-linked Bitcoin donors and family business interests to use the Strategic Bitcoin Reserve to support Bitcoin investors and the wider crypto industry. However, Schiff said Republicans should join Democrats in opposing such a move. The comments came as Strategy also returned to market debate. Schiff pointed to reports that Strategy sold 32 BTC for about $2.5 million at an average price near $77,135. He said the sale raised questions about demand if one of Bitcoin’s largest corporate holders reduced exposure. Concurrently, the discussion also moved to Strategy-linked products. Schiff said STRC trading below par showed investor concern over yield payments and could pressure the company to adjust terms. However, supporters have pushed back, saying the reported BTC sale represented only a very small portion of the company’s total Bitcoin position. BTC Exchange Inflows Show Short-Term Holder Stress On-chain data added to concerns around recent buyer behavior. Market commentary said more than 38,000 BTC moved to exchanges over 24 hours, with hourly Binance inflows sometimes reaching between 1,500 BTC and 4,000 BTC. Short-term holders reportedly sent more than 35,000 BTC to exchanges at a loss during the same period. These flows suggest recent buyers are reacting quickly to the sell-off, increasing realized losses as Bitcoin trades in a wide sideways range. Source: X The decline also followed rising geopolitical uncertainty . Market commentary linked part of the pressure to renewed tension around U.S.-Iran negotiations after reports that talks faced setbacks tied to ceasefire violations and regional military activity. Spot Bitcoin ETFs have also remained under pressure. Reports cited a streak of net outflows estimated in the billions of dollars, while U.S. equities continued rising on strong demand for artificial intelligence-linked stocks. That divergence has added to the view that capital has rotated away from crypto during the latest risk-off move. Bitcoin Dead Debate Returns The sell-off has revived the recurring “Is Bitcoin dead?” debate. A widely shared market commentary argued that similar questions appeared after earlier crashes, including Bitcoin’s 2018 decline toward $3,142 and its 2022 fall near $16,000. Both periods were later followed by new cycle highs. The commentary framed bear markets as a process that removes leveraged traders and weak holders while transferring supply to investors with stronger conviction. It also pointed to Bitcoin’s fixed issuance schedule, noting that higher prices do not create extra supply in the way they can for commodities or real estate. Source: X Matt Cole, CEO of Strive, also responded to the debate after the recent 2500 BTC buy . He said Strive’s balance sheet could withstand a repeat of the 2022 bear market without selling Bitcoin. Cole added that BTC was not dead and said fearful market conditions can create opportunities for long-term buyers. Bitcoin now needs to reclaim $71,305 to reduce immediate downside pressure. A stronger recovery would require a move back above $74,020, followed by resistance near $77,887 and $82,811. Until those levels are recovered, traders are watching whether BTC can hold the mid-$60,000 range or continue toward lower support.
2 Jun 2026, 19:28
Bitcoin’s $224K ‘fair value’ may emerge if sovereign debt fears deepen: Bitwise

A sovereign default-risk model estimates Bitcoin’s fair value at $224,000, as rising debt risks and bond-market stress could strengthen the asset’s long-term investment case.
2 Jun 2026, 19:26
XRP ETF Inflows Test Whether Institutional Demand Can Defy Weak Price Action

2 Jun 2026, 19:21
Tom Lee Targets $250K ETH as Bitmine Holds 5.4M Coins, Standard Chartered Flags Breakout

Ethereum News At the Proof of Talk conference in Paris, Fundstrat's head of research Tom Lee laid out a long-range case for ether reaching $250,000, framing current prices around $1,906 as "future ...
2 Jun 2026, 19:20
BTC Spot CVD Chart Analysis: Volume Heatmap and Order Flow Insights for June 2

BitcoinWorld BTC Spot CVD Chart Analysis: Volume Heatmap and Order Flow Insights for June 2 Traders analyzing Bitcoin’s spot market on June 2 are closely watching the Cumulative Volume Delta (CVD) chart for the BTC/USDT pair, a tool that provides a granular view of order flow dynamics. The chart, which combines a volume heatmap with CVD data, offers insights into buying and selling pressure at specific price levels, helping market participants identify potential support and resistance zones. Understanding the Volume Heatmap The top section of the CVD chart displays a volume heatmap, which tracks the concentration of trades executed at various price points. As the price lingers in a certain range or makes a significant move, the background color of that area brightens, visually highlighting where the most trading activity has occurred. These high-volume nodes can act as future support or resistance levels, as they represent prices where a large number of transactions have taken place, often attracting price action back to those levels. Interpreting the CVD Indicator The bottom section of the chart shows the CVD indicator itself, which categorizes buy and sell orders by trade size. As buy orders increase, the corresponding colored line rises. The yellow line tracks smaller orders ranging from $100 to $1,000, which often represent retail trading activity. In contrast, the brown line represents large orders from $1 million to $10 million, typically associated with institutional traders or high-net-worth individuals. Divergences between these lines can signal shifts in market sentiment. For example, if the brown line (large orders) rises while the yellow line (small orders) declines, it may indicate that institutional buyers are accumulating Bitcoin, potentially foreshadowing a bullish move. What This Means for Bitcoin Traders on June 2 For traders monitoring the BTC/USDT pair on June 2, the CVD chart offers a real-time snapshot of market microstructure. A rising CVD line, particularly for large orders, suggests aggressive buying pressure, while a declining CVD indicates selling dominance. When combined with the volume heatmap, traders can identify whether price movements are supported by high trading volume, adding conviction to breakouts or reversals. It is important to note that CVD is a derivative indicator and should be used alongside other technical tools and fundamental analysis for a comprehensive trading strategy. Conclusion The BTC spot CVD chart remains a valuable tool for understanding order flow dynamics in the Bitcoin market. By analyzing the volume heatmap and CVD indicator together, traders can gain a clearer picture of where buying and selling pressure is concentrated, helping them make more informed decisions. As always, no single indicator guarantees future price movements, and prudent risk management is essential. FAQs Q1: What does the Cumulative Volume Delta (CVD) measure? CVD measures the difference between buying and selling volume at each price level, showing whether aggressive buying or selling is dominating the market. Q2: How does the volume heatmap help in trading? The volume heatmap highlights price levels where significant trading activity has occurred. These levels can act as support or resistance, as they represent zones of high liquidity. Q3: What is the significance of the different colored lines in the CVD chart? The yellow line tracks smaller orders ($100-$1,000), typically from retail traders, while the brown line tracks large orders ($1 million-$10 million), often from institutional participants. Comparing their movements can reveal shifts in market sentiment between different trader types. This post BTC Spot CVD Chart Analysis: Volume Heatmap and Order Flow Insights for June 2 first appeared on BitcoinWorld .
2 Jun 2026, 19:19
Bitcoin Dives Below $67K as $1.25B Liquidated, Strive Adds 2,500 BTC, Schwab Targets 2027
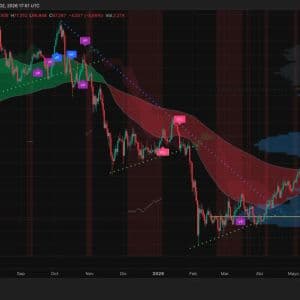
Bitcoin News Bitcoin endured its sharpest single-session drawdown since April, opening near $71,305 before sliding to an intraday low of $66,948 and settling around $67,287 — a 5.65% decline that e...


