


 Invest ideas
News
2 Jun 2026, 10:54
Render (RNDR) And Starknet (STRK): As GPU Marketplace Updates Hit RNDR And More zk‑DeFi Apps Launch On STRK, Do They Emerge As The “AI Compute + zk Rollup” Duo ...

The market is evaluating two of the most technically ambitious infrastructure plays in the digital asset space. Render (RNDR) —which is actively transitioning to its upgraded RENDER token—continues to expand its decentralized GPU marketplace, seeing week-on-week usage growth for its Dispersed distributed GPU network. The network is also proposing the integration of the Salad Network to route node rewards on-chain and capture real-world compute demand. Simultaneously, Starknet (STRK) is radically accelerating its zk-DeFi ecosystem. The network has recently launched the Starkzap v2 DeFi toolkit to streamline cross-chain bridging and swaps. Additionally, Starknet is heavily pivoting toward privacy and institutional compliance with the introduction of strkBTC for shielded Bitcoin and the STRK20s privacy standard. With major network updates hitting production, the market is asking a critical macro question: are these two assets coalescing into a dominant "AI Compute + zk Rollup" portfolio duo, or do their charts reveal they are still trading as entirely parallel, sentiment-driven narratives? Render (RNDR): AI‑GPU Beta In A Controlled Pullback Source: tradingview Render 's 30-day structural profile illustrates a classic "mid-range pullback after a strong leg." It is trading slightly below its 30-day Simple Moving Average (SMA), but remains comfortably above its 200-day baseline ($8.20). The Fibonacci Map ($7.00 to $11.50): 23.6% Retracement: $8.06 38.2% Retracement: $8.72 50.0% Retracement: $9.25 61.8% Retracement: $9.79 Immediate Support: $8.70 to $9.25: RNDR is sitting directly in this shallow "healthy retrace" zone. Holding daily closes within this 38.2% to 50% pocket keeps the broader $7.00 to $11.50 move in excellent shape. $8.00 to $8.10: The 23.6% retracement ($8.06). A drop here represents a normal, deeper retrace. However, losing this band entirely would point back toward the 200-day SMA ($8.20) and possibly the $7.00 base. $7.00 to $7.20: The 30-day swing low. A daily close below $7.00 effectively unwinds the entire recent leg, indicating the market is not yet ready to pay a premium for decentralized GPU infrastructure. Immediate Resistance: $9.60 to $9.80: The critical overhead block. This zone houses the 30-day SMA (~$9.60) and the 61.8% Fib ($9.79). RNDR needs to aggressively reclaim and hold above this band to rotate from a "pullback" phase back into "trend continuation." $10.80 to $11.50+: The local resistance band into the 30-day high. Sustained closes above $11.50 would be the first strong sign of another AI-GPU leg, which would likely be tied to verifiable marketplace usage and expanding node operator participation. The Read: RNDR is perfectly mid-range, trading under its short-term average but safely above its long-term base. To establish itself as the "AI compute" half of a core duo, it must defend the $8.70–$9.25 dips, convert the $9.60–$9.80 resistance into a solid floor, and back any push to $11.50+ with actual on-chain metrics rather than mere narrative spikes. Starknet (STRK): zk‑Rollup Beta Near First Fib Support Source: tradingview Starknet is trading in the lower half of its 30-day channel. Sitting well below both its 30-day and 200-day moving averages, it is clearly in a down-leg within a broader range, acting as an oversold beta. The Fibonacci Map ($0.80 to $1.60): 23.6% Retracement: $0.99 38.2% Retracement: $1.11 50.0% Retracement: $1.20 61.8% Retracement: $1.29 Immediate Support: $0.99 to $1.05: STRK's latest close ($1.05) rests right in this immediate "are we bouncing or breaking" zone. Holding above the 23.6% Fib ($0.99) suggests the upward move to $1.60 is only partially retraced. $0.80 to $0.85: The 30-day swing low. A daily close beneath $0.80 implies that the last leg has been fully unwound and that zk-L2 beta is firmly out of favor with the broader market. Immediate Resistance: $1.11 to $1.20: The primary mean-reversion block. This cluster contains the 38.2% Fib ($1.11), the 50% Fib ($1.20), and the 30-day SMA (~$1.15). STRK must reclaim and hold above this zone to shift its posture from "oversold beta" to "trend repair." $1.29 to $1.60+: The 61.8% Fib and the local high. A volume-backed push into this region is the required technical signal to prove Starknet is emerging as a credible, leading zk-rollup. The Read: STRK is hovering dangerously close to shallow Fibonacci support, with all meaningful structural resistance directly overhead. To be the "zk rollup" half of a core duo, it must rigorously defend the $0.99–$1.05 floor, climb into the $1.11–$1.20 block to flatten its moving average, and make a serious attempt at $1.60 as its new privacy and DeFi applications gain adoption. Conclusion: “AI Compute + zk Rollup” Core, Or Parallel Trades? The technical structures illustrate two assets that are currently consolidating, with RNDR looking structurally healthier than STRK's lower-range test. They Emerge as the Core Duo If: RNDR holds $8.70–$9.25, regains the $9.60–$9.80 moving average, and pushes toward $11.50+ as its Dispersed network and Salad integration generate verifiable GPU jobs and fees. STRK holds $0.99–$1.05, trades consistently above $1.11–$1.20, and pushes into the $1.29+ region on the back of rising TVL from the Starkzap v2 toolkit and strkBTC shielded transfers. Market narratives explicitly pair them together as a holistic Web3 infrastructure play ("Trade AI compute on RNDR, build zk apps on STRK") rather than treating them as isolated bets. They Remain Parallel Narrative Trades If: RNDR spends the summer boxed in between $8.00 and $10.00, with every rally aggressively sold near $11.50. STRK oscillates aimlessly between $0.85 and $1.10, repeatedly failing to clear the $1.20 overhead moving average block. Market mindshare, capital, and "must-own" status remain captured by competing assets like TAO for AI, Solana for high-speed trading, or established Ethereum L2s (Base, Arbitrum) for rollup liquidity. Final Verdict: The charts are currently screaming "structurally intact but consolidating, with clearly defined step-up bands." Neither asset has locked in an entrenched leadership position yet. Whether they break their resistance bands will depend entirely on actual GPU network usage and zk-app adoption, not just headline flow. Disclaimer: This article is provided for informational purposes only. It is not offered or intended to be used as legal, tax, investment, financial, or other advice.
2 Jun 2026, 10:53
Vitalik Proposes Options-Based Synthetic Assets as CME's 24/7 Crypto Market Logs $50M Debut

Crypto News Ethereum co-founder Vitalik Buterin has put forward a framework for building synthetic assets and algorithmic stablecoins that swaps out forced liquidations for an options-based primiti...
2 Jun 2026, 10:53
'I Received XRP Much Later': Ripple CTO Emeritus Clarifies Role

Ripple CTO emeritus breaks silence on role at company's inception.
2 Jun 2026, 10:53
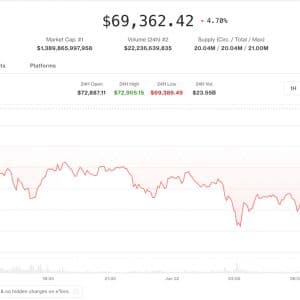
Bitcoin Slides Below $70K as Mt. Gox Moves $739M, CME Launches 24/7 Futures
Bitcoin News A Polymarket prediction wager tied to Strategy's first Bitcoin sale since 2022 has erupted into one of the platform's most contested resolutions of the year. The market, which asked wh...
2 Jun 2026, 10:39
Mt Gox move Bitcoin worth over $739 million ahead of payout deadline
Mt Gox, the defunct crypto exchange that lost over 850,000 Bitcoin ( BTC ) to hackers, has moved more than $739 million to a new wallet. On June 2, Mt Gox’s cold wallet transferred 10,423 BTC, valued at about $739 million, to a new wallet, 14FEEM…9nc9eq, according to data from Arkham Intelligence analyzed by Finbold. Two hours after making this transfer, the designated rehabilitation trustee initiated another movement of 116.29 BTC, worth approximately $8.07 million, to a new wallet, 1A4xgf…BJQNj4. On-chain transactions related to Mt Gox. Source: Arkham Intelligence As such, the Mt Gox cold wallet held roughly 34,504 Bitcoin, with a net value of more than $2.4 billion at the time of publication. The last time its cold wallet had a transfer of this size was six months ago, when the rehabilitation trustee conducted several internal consolidations, potentially in preparation for upcoming fund distributions. Mt Gox Bitcoin repayment schedule Mt. Gox’s rehabilitation trustee received approval from the Tokyo court to extend the final deadline from October 31, 2025, to October 31, 2026, to complete repayment processing. As such, the longest-running crypto creditor saga is approaching the end after more than a decade of court battles. Mt Gox balance history, Source: Arkham Notably, the last time the defunct crypto exchange initiated major distributions of Bitcoin and Bitcoin Cash to creditors was in July 2024. During this Bitcoin payout, around 47,000 BTC was distributed through several cryptocurrency exchanges, including Kraken , Bitstamp, and BitGo. Additionally, the rehabilitation trustee distributed around 10,000 BTC in early 2025, thereby increasing the total verified creditors to over 19,000. With about five months until its final Bitcoin payouts, its latest BTC transfers could be a preparatory move to facilitate seamless distribution. The post Mt Gox move Bitcoin worth over $739 million ahead of payout deadline appeared first on Finbold .
2 Jun 2026, 10:35
Solana Price Prediction: Solana’s Ninth Red Candle Puts SOL at a Turning Point

Solana has entered a critical ninth monthly candle after eight straight red monthly closes, putting the $80 to $50 range in focus as a possible accumulation zone. At the same time, a short term wedge breakout could confirm a local low and shift attention back toward $86 to $94. Solana Price Enters Critical Ninth Monthly Candle as $80 to $50 Zone Comes Into Focus Solana has printed eight straight red monthly candles for the first time in its history, according to a chart shared by Crypto Patel on X. The analyst said SOL is now forming its ninth monthly candle, a point he compared with the previous Solana bear cycle. Solana Monthly Chart. Source: Crypto Patel on X The chart shows SOL falling from a high near $253 to a low near $67 during the latest decline. The current monthly structure is marked inside a blue downward channel, with each red candle numbered from one to nine. Crypto Patel said this is the first time Solana has recorded eight consecutive red monthly candles. He added that the ninth candle is still forming, so the setup needs a monthly close before any stronger signal appears. The analyst compared the current structure with the 2021 cycle. After Solana reached its former high near $260 in November 2021, SOL later dropped to about $8. That earlier bear phase also had nine red monthly candles, according to Crypto Patel. However, those candles were not consecutive. He said the ninth red monthly candle marked the bottom near $8 before Solana later moved to a new high near $295. The current chart shows a similar waiting phase, but the structure is not confirmed yet. Crypto Patel said the main accumulation range to watch sits between $80 and $50 if SOL extends lower. That zone matters because Solana is already trading near the lower part of the current decline. A deeper move into the range could test whether buyers start building a longer term base. The analyst said a repeated fractal could later point toward a move into the $500 to $1,000 region over the next one to two years. However, that view depends on the current monthly candle and whether SOL forms a macro bottom instead of continuing lower. For now, the chart shows Solana inside an extended monthly downtrend. The next signal depends on how the ninth monthly candle closes and whether buyers defend the $80 to $50 range. Solana Price Eyes Local Low as SOL Wedge Breakout Comes Into Focus Solana may be close to forming a local low after completing a five wave decline inside a short term wedge, according to a chart shared by More Crypto Online on X. The analyst said Wave (5) now looks complete. He added that a break above the upper boundary of the wedge could give the first signal that SOL has formed a local bottom. Solana Four Hour Chart. Source: More Crypto Online on X The chart shows SOL moving lower inside a narrowing wedge after failing to hold its May recovery. Price has been making lower highs and lower lows, which kept pressure on the short term structure. The latest move pushed SOL toward the main range support area. That zone sits between $71.92 and $77.96, with the chart also marking $75.41 as another key level inside the range. More Crypto Online marked the decline as a possible completed Wave (5). If that count holds, SOL may now need a breakout above the wedge to confirm that sellers are losing control. The first upside area sits near $86.60, which lines up with the lower part of the red retracement box. Above that, the chart marks additional resistance near $88.71, $90.87, and $94.04. A move through the wedge would not confirm a full trend reversal by itself. However, it could become the first sign that SOL has finished its local decline and started a corrective rebound. If SOL fails to break above the wedge, the support zone remains in focus. A deeper move into the $71.92 to $77.96 area would test whether buyers can still defend the main range. For now, the chart shows Solana at a short term decision point. The next signal depends on whether SOL breaks above the wedge or stays trapped below resistance.


