


 Invest ideas
News
29 May 2026, 23:57
BTC buy orders hit $443 million near $70,000

🚨 Major buy interest in $BTC builds at $70,000 with $443 million in orders. Buy orders cluster between $72,000 and $70,000, with new support at $68,505. Continue Reading: BTC buy orders hit $443 million near $70,000 The post BTC buy orders hit $443 million near $70,000 appeared first on COINTURK NEWS .
29 May 2026, 23:45
Ethereum’s Largest Wallets Now Control Over 22% of Supply Amid Fresh Accumulation Wave

Ethereum (ETH) briefly plunged below the $2,000 threshold this week for the first time since March 29. While the price has since stabilized and is currently trading near $2,002, it still remains almost 60% below August’s high of nearly $5,000. But data suggest that ETH’s largest whales are accumulating again ETH Whales Tighten Grip on Supply Wallets holding at least 100,000 Ethereum now collectively own 17.41 million ETH, the highest level in nine weeks. These holdings account for 22.03% of Ethereum’s total supply and mark a 10-week high. The latest findings come after Santiment reported that the asset’s fall below $2,000 triggered a wave of “buy the dip” calls from retail traders. According to the analytics firm, crypto markets typically react to sharp declines in two ways: either fear takes over, and traders begin abandoning the asset, or optimism grows as traders view lower prices as a buying opportunity. The second reaction appeared to be dominating sentiment around ETH despite the recent weakness, which essentially meant that retail traders were increasingly confident that the decline represented a discounted entry point rather than a warning sign of deeper downside. However, Santiment warned that excessive optimism from the crowd has historically been a bearish signal, as retail traders often misread market direction during volatile periods. The firm went on to add that a stronger buying opportunity may emerge once the current FOMO fades and sentiment shifts toward panic, which it described as a more typical setup seen near market bottoms. Downside Targets Bearish technical signals have not completely disappeared from the market. Crypto analyst Ali Martinez, for one, said Ethereum could see accelerated downside pressure if it records a weekly close below the $1,850 level. Based on the broader channel structure, Martinez identified two potential downside targets following the rejection. The first target stands around $1,560, which he described as interim structural support, while the second target sits near $1,070, which marks the lower boundary of the crypto asset’s multi-year range. The post Ethereum’s Largest Wallets Now Control Over 22% of Supply Amid Fresh Accumulation Wave appeared first on CryptoPotato .
29 May 2026, 23:30
XRP’s Latest Move To DeFi: What This Upgrade Will Mean For Users And Investors

The XRP Ledger Foundation has introduced a new draft proposal that could significantly expand how trading and liquidity work on XRP’s decentralized exchange (DEX) . The proposed update, called AMM Swappable Curves, will allow XRPL users and liquidity providers to choose different pricing models when creating liquidity pools. This would mark a major upgrade to XLS-30 , XRPL’s current Automated Market Maker (AMM) system, which launched on the mainnet in March 2024. How XRP’s Proposed DeFi Upgrade Changes Things For Users Currently, the original XRPL AMM uses only one curve model called the “constant product” system. This model works well for volatile assets, but can be less effective for stablecoins or tokenized real-world assets (RWAs) . The new proposal, announced by the XRP Ledger Foundation in an X post on May 26, aims to solve that problem by introducing two additional models, StableSwap and concentrated liquidity, for Ledger users and investors. According to the Ledger Foundation , these new options could improve capital efficiency and reduce price slippage. They said that it also offers more accurate pricing across several markets, including foreign exchange, stablecoins, RWAs, and DeFi trading. The proposal also mentions an upgrade called the pluggable curve architecture . With this new update, liquidity pool creators will finally be able to choose the pricing formula that best matches the type of assets being traded on the Ledger. Instead of forcing every market into a single system, the AMM could support multiple trading models simultaneously. Notably, the upgrade proposal was filed by core developers Denis Angell and Roman Thpt. It is currently still in the draft stage, meaning validators have not yet approved it. If passed, the amendment would extend XLS-30 without replacing or disrupting existing liquidity pools already running on the Ledger . Why The Proposal Matters For Stablecoins and RWAs On GitHub, the Foundation further explained the StableSwap model in its XLS-30 upgrade proposal. StableSwap is designed for assets such as USDT and USDC, as well as tokenized RWAs tied to fiat currencies. Since these assets trade around the same value and see very limited price swings compared to cryptocurrencies like XRP and Bitcoin , StableSwap can offer tighter pricing and lower slippage during trades. The proposal also mentions a curve diversity feature. Under this structure, the Ledger would no longer force every asset pair to use the same trading model. For example, volatile assets like XRP or meme coins experience sharp price movements , so the current the Ledger model works well for them. However, since stablecoins like USDT and USDC tend to stay close in value, the model becomes less efficient, sometimes even resulting in worse pricing during trades. Overall, the proposal would allow the Ledger developers and users to choose the trading system that best suits the assets in a pool. Stablecoins could use StableSwap to keep prices steadier and reduce price swings during trades. Meanwhile, larger traders and liquidity providers could use concentrated liquidity pools to place funds closer to active trading prices and make better use of their money.
29 May 2026, 23:15
Bitcoin Pops Above $73,000—But The Tape Screams: Selling Pressure Hits Months-High

Bitcoin (BTC) regained the $73,000 level on Friday after earlier dipping to $72,500 earlier in the day for the first time since April. While the rebound may look like a quick recovery on the chart, market analyst J.A. Maartun said the bigger story is what the data shows about selling pressure underneath the surface. In his view, this decline is not being driven by price alone, but by coordinated risk-off behavior across futures, spot markets, and exchange-traded funds (ETFs). Futures Sell Hard, Spot Follows According to Maartun, futures traders have been particularly aggressive. He pointed to selling pressure that has reached its strongest level since March, describing a clear imbalance in derivatives activity. One of the key measures he cited was Net Taker Volume at minus $948 million. He also noted that sellers were outpacing buyers by roughly $40 million per hour, a pattern that typically reflects an unwillingness from the market to absorb sell orders and a broader shift toward defense rather than buying. Maartun said the spot market is showing similar weakness, reinforcing the message coming from futures. As part of his comparison, he referenced Coinbase trading at a -0.21% discount versus Binance. In his interpretation, a negative premium like this often signals that US participants are selling more forcefully than counterpart liquidity sources, confirming that the risk-off mood isn’t limited to derivatives desks. He added that this spot softness aligns with ongoing ETF outflows , which have continued to pull capital out of Bitcoin-focused vehicles. Maartun highlighted two consecutive weeks of net outflows, and he said more than $1.0 billion exited from BlackRock’s Bitcoin fund just last week alone. With that institutional demand apparently cooling, he argued the market has fewer buyers ready to step in—creating additional downside pressure even when price briefly snaps back above major levels. Why Bitcoin Bottoming Could Take Time At the same time, Maartun noted that the early data is beginning to hint at something more constructive. He pointed to improving conditions indicated by the stablecoin supply ratio (SSR) indicator, and said Net Taker Volume is nearing historical exhaustion levels. His framing is that extreme selling sometimes marks a turning point, because it drains leverage and forces weaker hands out of the market. On that basis, he suggested the odds of a short-term relief rally are increasing, even if a larger cycle turnaround may take longer. To place expectations in context, Maartun compared how long previous cycle bottoms took to arrive after Bitcoin Halving events . He listed historical timing as 2012, taking 777 days, 2016, taking 889 days, and 2020, taking 925 days. He then compared those benchmarks to the current cycle, estimating it at 768 days—implying that the market may still be in a phase where bottoming processes can unfold slowly rather than in a single instant. Featured image created with OpenArt; chart from TradingView.com
29 May 2026, 23:13
Bitcoin Bid Wall Stacks $512M Near $70K as RSI Hits 3-Month Low, Coldcard MK5 Debuts
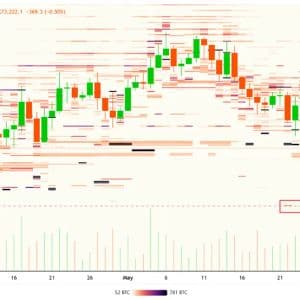
Bitcoin News Bitcoin dip buyers have stacked roughly $512 million in limit orders between $72,000 and $68,500, carving out a dense demand zone as the largest cryptocurrency tests the lower edge of ...
29 May 2026, 23:00
Ethereum’s ‘deeper problem’ – It’s not just macro risk weighing ETH down

Nansen believes that ETH's weakness goes beyond short-term macro pressure, but there's more to the story.


