


 Invest ideas
News
27 May 2026, 10:54
AI-driven DeFi attacks caused $722 million losses in April

🚨 AI-driven hacks made DeFi lose $722 million in April. Permissionless transactions and bridge flaws posed major risks in $AAVE and others. ⚠️ Critical data: May saw attack volumes drop, but human error and centralization remain the real threat. Continue Reading: AI-driven DeFi attacks caused $722 million losses in April The post AI-driven DeFi attacks caused $722 million losses in April appeared first on COINTURK NEWS .
27 May 2026, 10:54
Bitcoin clings to $75,000 support as bear market signals resurface
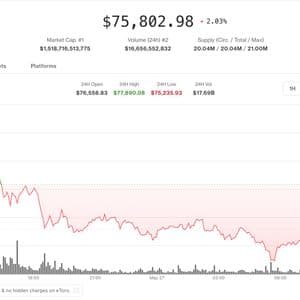
Bitcoin hovered below Tom Lee's $76,000 bull-market threshold while hyperliquid and monero bucked broader crypto weakness.
27 May 2026, 10:54
HTX Hot Listings Weekly Recap (May 18–24): New Listing ZEST Surges 131%! Privacy Sector Stages a Comeback, AI Narrative Continues to Gain Traction

The third week of May saw a long-awaited rebound in profit-making momentum sweep across the crypto market. With Bitcoin oscillating within a key range, the ensuing sentiment spillover energized the altcoin market. Three dominant narratives defined this week’s price action: privacy coins, led by ZEC, staged a broad-based rally amid incrementally improving regulatory expectations; the Perp DEX narrative, spearheaded by HYPE, continued to attract sustained capital inflows; and NEAR carved out an independent run, backed by solid AI infrastructure fundamentals. According to HTX platform data, top-performing assets over the past week (May 18–24) spanned multiple core sectors — including privacy, AI, DeFi, and Perp DEX — with the newly listed ZEST emerging as the week’s standout dark horse, posting a staggering 131% gain. On-Chain Derivatives Narrative Strengthens as Perp DEX Heats Up, BTCFi and DeFi Rally One of the week’s key narratives centered on the decentralized perpetual exchange sector, with HYPE as the top gainer. As market volatility picked up, user demand for high-efficiency, high-leverage, and low-slippage trading environments intensified. Consequently, the market is repricing the value of on-chain financial infrastructure. Amid the continued advancement of BTC Layer 2 solutions, staking yields, restaking, and on-chain asset expansion, BTCFi is emerging as a major incremental growth sector — making it the next frontier after the ETH-ecosystem DeFi. ● HYPE (Hyperliquid): Up 38% on the week, HYPE stands as the leading representative of on-chain derivatives trading infrastructure. Hyperliquid is a high-performance L1 built from the ground up, with a vision to create a fully on-chain, open financial system. ● ZEST (Zest Protocol): A newly listed asset that surged 131% this week, making it the week’s top gainer. Zest Protocol is a Bitcoin lending protocol. As a new BTCFi-focused token, ZEST’s explosive performance reflects the market’s continued enthusiasm for the Bitcoin Finance (BTCFi) narrative. ● ONDO (Ondo Finance): Up 28% on the week, ONDO is a flagship RWA/DeFi asset. Long regarded as a key representative of real-world assets (RWA) and on-chain yield protocols, ONDO provides the infrastructure for securities tokenization and the development of protocols that support these assets, such as Flux Finance. Privacy Sector Bounces Back: ZEC and NIL Rally as Capital Reassesses Anonymity Value Another highly distinctive theme this week was the broad-based recovery of the privacy sector. As on-chain regulatory scrutiny intensifies, asset traceability improves, and user demand for privacy protection grows, the market has begun to revisit the value of anonymous transactions, zero-knowledge proofs (ZK), and privacy infrastructure. ● ZEC (Zcash): Up 22% on the week, ZEC is a veteran privacy asset. Compared to smaller-cap speculative plays, ZEC benefits from a more established technical foundation and greater market familiarity, making it a natural first mover as the privacy narrative reawakens. ● NIL (Nillion): Up 60% on the week. Nillion is a private computation and storage network, built for AI and data applications. The network leverages Privacy-Enhancing Technologies (PETs) to enable data computation and storage while preserving privacy, unlocking use cases such as private personalized AI, encrypted databases, and other privacy-preserving applications. AI Narrative Momentum: NEAR Leads as Infrastructure AI Assets Attract Capital AI remains, without question, one of the most enduring market narratives. Looking at performance over recent weeks, the AI sector continues to appear with high frequency on HTX’s top-gainers list, demonstrating far greater staying power than shorter-cycle themes. As AI Agents, on-chain compute infrastructure, and decentralized inference networks continue to evolve, attention is shifting toward the players that can truly support real-world AI adoption. ● NEAR (NEAR Protocol) : Up 56% this week. NEAR is a composite asset that combines public blockchain, developer ecosystem, and AI infrastructure narratives. NEAR Protocol serves as the foundational architecture for the open network, providing a decentralized application platform that delivers a clean and user-friendly experience for both developers and end users. ● GENIUS (Genius): Up 54% on the week. Genius Terminal is the first private and ultimate on-chain terminal, a trading operating system (OS) built for professional users. It is designed to serve those who want DeFi functionality without the friction of complex interactions. Structural Market Shift Prompts Strategic Asset Selection This week’s market action has made one thing clear: the market has visibly shifted away from single-theme speculation and into a phase of “multiple parallel narratives with structurally allocated capital.” The on-chain derivatives infrastructure represented by HYPE, the privacy sector recovery led by ZEC, and the large-cap AI asset reevaluation driven by NEAR together form the core upside momentum of the week. As a global leading digital asset trading platform, HTX continuously monitors evolving market trends, maintaining a sharp focus on key sectors including AI, BTCFi, DeFi, RWA, and privacy infrastructure. HTX consistently lists quality and high-potential assets, helping users more effectively capture structural opportunities amid complex market conditions. As the market presents new narrative rotation, assets with genuine long-term value and robust ecosystem support may well emerge as the primary focus of capital flows in the future. To learn more about HTX, please visit https://www.htx.com/ or HTX Square , and follow HTX on X , Telegram , and Discord . The post HTX Hot Listings Weekly Recap (May 18–24): New Listing ZEST Surges 131%! Privacy Sector Stages a Comeback, AI Narrative Continues to Gain Traction first appeared on HTX Square .
27 May 2026, 10:50
XRP Capitulation Zone? Data Shows Average Wallet Down by 47%

Historic XRP indicator flashes oversold conditions after price selloff.
27 May 2026, 10:45
Bitcoin Spot CVD Chart Shows Key Order Book Dynamics at 10:00 a.m. UTC on May 27

BitcoinWorld Bitcoin Spot CVD Chart Shows Key Order Book Dynamics at 10:00 a.m. UTC on May 27 Traders monitoring Bitcoin price action on May 27 observed notable activity in the spot order book for the BTC/USDT pair, as reflected in the Cumulative Volume Delta (CVD) and volume heatmap charts at 10:00 a.m. UTC. These tools provide a granular view of buying and selling pressure at specific price levels, offering insights beyond simple price movement. Understanding the Volume Heatmap The top section of the chart displays a volume heatmap, which tracks the concentration of trades at various price levels over time. Brighter areas on the heatmap indicate either prolonged price consolidation or significant directional movement through a particular zone. These high-volume nodes can act as future support or resistance levels, as traders often react to previously established price points. For the May 27 session, the heatmap revealed distinct clusters of activity, suggesting key price levels where market participants have shown heightened interest. These zones are closely watched by technical analysts for potential breakout or reversal signals. Cumulative Volume Delta Breakdown The lower portion of the chart shows the Cumulative Volume Delta (CVD), which separates buy and sell orders by trade size. The CVD line rises as buy orders accumulate and falls when selling pressure dominates. This indicator helps traders gauge the aggressiveness of buyers versus sellers in real time. Two specific trade-size categories are highlighted: the yellow line tracks orders between $100 and $1,000, representing retail-sized trades, while the brown line tracks large institutional-sized orders between $1 million and $10 million. The divergence or convergence of these lines can signal shifts in market sentiment. For instance, if the brown line rises sharply while the yellow line remains flat, it may indicate that large players are accumulating positions, potentially foreshadowing a price move. Why This Matters for Traders Order book analysis, particularly through CVD and volume heatmaps, provides a deeper understanding of market microstructure. Unlike simple price charts, these tools reveal the underlying flow of capital and the balance between supply and demand at a granular level. For active traders, this information can help in identifying entry and exit points, managing risk, and anticipating short-term volatility. While the CVD chart is a powerful tool, it is most effective when used in conjunction with other technical indicators and broader market context. No single metric provides a complete picture, but the order book dynamics captured at 10:00 a.m. UTC on May 27 offer a valuable snapshot of current Bitcoin market conditions. Conclusion The BTC spot CVD chart for May 27 at 10:00 a.m. UTC illustrates the importance of monitoring order book depth and trade-size distribution. By analyzing the volume heatmap and cumulative volume delta, traders can gain actionable insights into market sentiment and potential price levels. As always, these tools should be part of a comprehensive trading strategy that accounts for risk management and broader market trends. FAQs Q1: What is the Cumulative Volume Delta (CVD) in Bitcoin trading? The CVD tracks the net difference between buy and sell orders over time, categorized by trade size. It helps traders understand whether buying or selling pressure is dominant at a given moment. Q2: How does the volume heatmap identify support and resistance levels? The heatmap highlights price levels where high trading volume has occurred. These areas often act as support (price floor) or resistance (price ceiling) because traders remember and react to these levels. Q3: Why are trade sizes between $100 and $1,000 and $1 million to $10 million specifically tracked? These ranges represent two distinct market participant groups: retail traders (smaller orders) and institutional or large-scale traders (whale orders). Monitoring both provides insight into whether retail or institutional sentiment is driving the market. This post Bitcoin Spot CVD Chart Shows Key Order Book Dynamics at 10:00 a.m. UTC on May 27 first appeared on BitcoinWorld .
27 May 2026, 10:43
Bitcoin Price Prediction: Whale Dumped Blackrock ETF in The Dark Pool

A single entity just moved $1.289 billion in BlackRock’s IBIT off-exchange as Bitcoin tries to hold its footing amid bearish price prediction. The trade was executed via dark pool, or a privately negotiated transaction designed to prevent the spot price from being instantly crushed. It’s the largest dark-pool trade of its kind that we have ever seen. The move landed on a brutal day. U.S. spot Bitcoin ETFs logged $336 million in total net outflows, extending what is now a seven-consecutive-day bleed, the second-longest since ETF launch in January 2024. BlackRock IBIT Sees Massive $1.29B Dark Pool Trade A huge $1.29 billion dark pool trade tied to BlackRock’s IBIT Bitcoin $BTC ETF crossed Nasdaq on Tuesday. The block transaction involved nearly 29 million shares and briefly exceeded the fund’s typical daily trading volume.… pic.twitter.com/qOYvWvGWlx — BSCN (@BSCNews) May 27, 2026 Total losses over that stretch clocked at $1.88 billion. IBIT alone processed $192.44 million in net redemptions on the day, as overall momentum was controlled by sellers. Arthur Hayes has directly linked Bitcoin’s recent crash to IBIT outflows, pointing to the $1.2 billion exiting spot Bitcoin ETFs across just three trading days. Macro fragility, basis-trade unwinds, and leveraged long liquidations are compounding the pressure. Discover: The Best Crypto to Diversify Your Portfolio Bitcoin Price Prediction: Recover Above $78,500? Bitcoin is currently oscillating in the $75,000–$78,000 range, with $78,500 identified as a critical pivot level in the options market, acting as both a ceiling and a structural marker for any short-term recovery attempt. The recent selloff represents nearly a 7% drawdown from the $83,000 zone, making it Bitcoin’s steepest weekly decline since October 10th last year. On-chain demand signals are equally grim. CryptoQuant analyst flags apparent demand at a year-to-date low of -147,000 BTC. A number that reinforces a corrective bias until buying volume reverts. Technical reads on Bitcoin’s chart describe price action as consolidation after rejection from higher levels, inside a broader downward channel originating at the all-time high of $126,000. Bitcoin (BTC) 24h 7d 30d 1y All time If IBIT flows reverse with a sustained inflow return, BTC could reclaim $78,500 and target $83,000 resistance. Historical precedent shows ETF inflow inflections mark local bottoms. However, if $75,000 fails as support, the price could retest sub-$70,500 lows seen during the latest selloff leg. BlackRock’s own analysis cites Fed policy uncertainty, leverage reduction, and the clearing of “outsized positions” as the primary volatility drivers — none of which have been fully resolved. Resistance on any recovery sits at $89,500–$90,500 , with a more distant target near $93,300–$95,500 if momentum rebuilds. Discover: The Best Token Presales Bitcoin Hyper Targets Early Mover Upside as Bitcoin Stalls When the market’s largest asset drops by 7% in two weeks, traders start reassessing where asymmetric upside actually lives. Spot BTC at $75,000 offers recovery potential, but recovery to what, exactly? Even a return to $95,000 is a 26% move. Early-stage infrastructure targeting Bitcoin’s own scalability limitations is a different conversation entirely. Bitcoin Hyper ($HYPER) is positioning directly in that gap. It’s the first Bitcoin Layer 2 integrating the Solana Virtual Machine (SVM), delivering sub-second finality and low-cost smart contract execution, while preserving Bitcoin’s underlying security. The pitch is direct: break through Bitcoin’s core bottlenecks, such as slow transactions, high fees, and no programmability, without sacrificing the trust layer. The project has already raised $32 million , with the current presale price at $0.0136807 and staking rewards available for early participants. A Decentralized Canonical Bridge handles BTC transfers natively. Researching Bitcoin Hyper represents a structurally different risk profile from spot BTC at current prices. The post Bitcoin Price Prediction: Whale Dumped Blackrock ETF in The Dark Pool appeared first on Cryptonews .


