


 Invest ideas
News
23 May 2026, 16:00
Bitcoin Bottom May Be 2 Months Away, On-Chain Data Suggests

Over the past week, Bitcoin has traded sideways in the high $70,000 region, unable to reclaim the psychological $82,000 level that has eluded market bulls since mid-May. Notably, the $76,000 price level has now been tested three weeks in a row and held each time, emerging as a real support zone. However, an obscure on-chain metric may be flashing the clearest bottom signal in Bitcoin’s history. Key Bearish Signal Arises From Investor Cost Basis Data In an X post on May 22, CryptoChan shares data from an historically reliable bottom indicator built from two realized price bands: the 6m–10y Realized Price, representing the average acquisition cost of long-term holders, currently at $60,316; and the 0–10y Realized Price, a broader market average cost basis, sitting at $64,412. The ratio between these two bands indicates how stressed long-term holders are relative to the broader market. When it drops below 0.936 and then recovers back toward 1.0, it has marked the precise bottom moment in every prior Bitcoin cycle. 历史经验表明,当黑线逼近绿线,往往也正是熊市尾声与历史级大底的标志性信号──────────────────────── 【 #BTC 四年周期系列更新】当前图中指标已升至 0.936 2015年熊底该指标从 0.936 升到 1,花费 59天18-19年熊底该指标从 0.936 升到 1,花费 66天… https://t.co/pOwvk1rsDu pic.twitter.com/kr6P4m7bBy — CryptoChan (@0xCryptoChan) May 22, 2026 This is because when the ratio touches 1.0, the green line (long-term holder cost) overtakes the black line (full market cost), meaning even the most conviction-driven holders are underwater. That is the moment when selling pressure is fully exhausted, and market sentiment is in extreme panic. In the 2015 bear market bottom, the ratio took 59 days to climb from 0.936 back to 1.0. In the 2018–2019 bear bottom, the recovery took 66 days. In the November 2022 FTX collapse-driven bottom, the journey took 50 days. The ratio is presently at 0.936 again. If the current reading holds and historical data repeats itself, Bitcoin’s definitive bottom window may open sometime around mid-to-late July 2026. Bitcoin Price Overview At the time of writing, Bitcoin is valued at $75,269, following a 2.84% loss in the last week. In tandem, the asset’s performance on larger timeframes is also negative, with declines of 4.65% and 3.55% on the weekly and monthly charts, respectively. According to data from Coincodex , the Fear & Greed Index stands at 28, indicating that fear is significantly affecting the market. Nevertheless, CoinCodex analysts are backing a short squeeze toward $83,354 over the next five days. In a month, they predict a return to $77,741. However, their three-month projection points to a $90,529 price target, suggesting a potential 16% gain over current market prices.
23 May 2026, 15:59
Ethereum Price Prediction: Will ETH Crash Below $2K This Week After Key Breakdown?
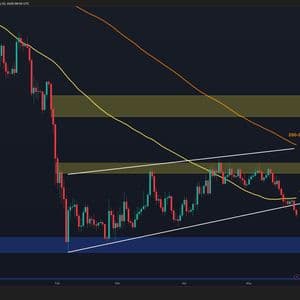
Ethereum has come under renewed selling pressure after failing to reclaim a key dynamic resistance cluster around the 100-day moving average and the lower boundary of the previous consolidation range. While the broader market remains under pressure, ETH is now approaching a critical support region where short-term reactions may emerge. However, unless buyers quickly reclaim lost levels, the path of least resistance appears tilted toward further downside continuation. Ethereum Price Analysis: The Daily Chart On the daily timeframe, ETH faced a strong rejection from the confluence of the 100-day moving average near the $2.1K-$2.15K region and the broken wedge support structure, which had previously acted as dynamic support for several months. Following this rejection, the asset decisively broke below the wedge formation, confirming a notable bearish structural shift in the market. This breakdown signals weakening bullish momentum and increasing dominance from sellers. Currently, ETH is trading around the $2K psychological support zone after losing the important $2.1K level. The overall structure suggests that the recent move could evolve into a classic breakdown-and-pullback scenario, where price may temporarily retest the broken wedge boundary and the $2.1K-$2.15K resistance area before continuing lower. If bearish momentum persists, the next major downside target lies near the substantial $1.8K support region, which previously acted as a strong demand zone during the February capitulation event. A break below that area could expose Ethereum to deeper corrections toward the lower macro support levels around $1.55K-$1.6K. On the bullish side, reclaiming the 100-day MA around $2.15K would be the first sign that buyers are attempting to invalidate the recent bearish breakdown. ETH/USDT 4-Hour Chart On the 4-hour timeframe, Ethereum’s market structure remains clearly bearish, reflecting growing fear and uncertainty among market participants after the sharp impulsive decline from the $2.4K region. The price has consistently formed lower highs and lower lows, while recent selling pressure accelerated after ETH lost the important ascending support trendline near $2.2K-$2.25K. This breakdown triggered another wave of liquidation-driven selling, pushing the asset directly into a key 4-hour order block located around the $1.95K-$2K support zone. This region is highly important because it has served as a major reaction area for an extended period of time and likely contains significant resting liquidity. As a result, Ethereum could experience a short-term corrective bullish retracement from this zone before any continuation toward lower prices. In the event of a rebound, the primary pullback target sits around the $2.1K-$2.15K area, which now acts as the nearest supply zone and potential pullback resistance. This region also coincides with the previously broken market structure, increasing the probability of renewed selling pressure if the price revisits it. However, unless ETH manages to reclaim and stabilize above the $2.2K region, the broader short-term trend remains bearish, and any recovery rally may simply be considered a corrective move within a larger downtrend. Sentiment Analysis The latest Ethereum liquidation heatmap reveals a substantial liquidity concentration below the current market price, with the most significant cluster positioned around the $1.8K region. This zone has emerged as a major liquidity magnet, containing a dense accumulation of leveraged positions that could attract price action in the coming phase. Historically, Ethereum tends to gravitate toward high-liquidity regions before establishing a meaningful reversal. The recent decline and weak recovery structure suggest that the market may still require a final liquidity sweep to fully reset positioning and flush out remaining leveraged participants. As a result, the $1.8K area becomes a critical level to monitor, as it holds the potential to absorb incoming selling pressure while clearing a large portion of resting liquidity. From a market mechanics perspective, such liquidity grabs often occur before the beginning of a stronger impulsive trend. If Ethereum eventually taps into this zone, it could trigger panic-driven selling and forced liquidations, creating favorable conditions for large players to accumulate at discounted prices. Consequently, while short-term rebounds remain possible, the broader liquidity structure indicates that Ethereum may still be vulnerable to a deeper corrective move toward the $1.8K cluster before a sustainable bullish expansion can begin. The post Ethereum Price Prediction: Will ETH Crash Below $2K This Week After Key Breakdown? appeared first on CryptoPotato .
23 May 2026, 15:55
The Ascent of ZEC, the ARMA Bill, and More – Week In Review

Crypto’s latest headlines spanned regulation, reserves, macro, privacy, and market structure. The OCC’s crypto trust charter approvals drew new scrutiny, while lawmakers proposed ARMA to build a 1 million bitcoin strategic reserve. Tom Lee argued Ethereum’s weakness is temporary and tied to short-term macro noise, Zcash surged amid squeeze warnings, and Coinbase moved to launch
23 May 2026, 15:34
Chainlink connects to 5 new networks with CCIP rollout

🚀 Chainlink brings CCIP and core services to 5 new blockchain networks. The $LINK ecosystem now connects to Creditcoin, Neo X, Tempo, Ink, and Robinhood Chain testnet. 🔑 Key point: This move enables faster, more secure data and asset transfer across chains. Continue Reading: Chainlink connects to 5 new networks with CCIP rollout The post Chainlink connects to 5 new networks with CCIP rollout appeared first on COINTURK NEWS .
23 May 2026, 15:32
Ripple’s XRP Sees Shift as Large Exchange Withdrawals Jump To 57.6%

XRP continued to trade sideways on Saturday, holding steady after a rough week of intense selling pressure across the crypto market.
23 May 2026, 15:25
Bitcoin Falls Below $75K as SEC Greenlights Nasdaq BTC Options, Spot ETFs Bleed $1.26B
Bitcoin News Bitcoin slipped below $74,500 for the first time in four weeks, extending a punishing nine-session losing streak that erased much of the recent Bitcoin rebound. The decline triggered a...


