


News
1 Jun 2026, 08:06
Vijayawada Crypto Scam: How a Real Estate Broker Was Defrauded of Rs 1.4 Crore

BitcoinWorld Vijayawada Crypto Scam: How a Real Estate Broker Was Defrauded of Rs 1.4 Crore Vijayawada crypto scam investigations are currently underway after a prominent local real estate broker was systematically defrauded of Rs 1.4 crore by an international cybercrime network. As of June 1, 2026 , authorities are tracking a sophisticated operation that utilized simulated MetaMask wallets and social engineering to target high-net-worth individuals. This report details the mechanics of the fraud, the involvement of international actors, and essential security protocols to safeguard digital assets. How Did the Rs 1.4 Crore Vijayawada Crypto Scam Occur? The Vijayawada crypto scam followed a structured, multi-phase execution designed to build false trust and bypass traditional financial security layers: Social Engineering Foundation : The victim was initially contacted on social media by a fraudster posing as an expert in stock market and cryptocurrency investments . The perpetrator spent weeks building credibility by sharing fabricated, high-profit performance data. The Multi-Layered Deception : A female accomplice facilitated the process, guiding the broker through the installation of a MetaMask digital wallet. To further cement the illusion, the scammers injected fake crypto tokens into the wallet, displaying an artificial, rapid increase in the victim’s portfolio value. Capital Extraction : Once the victim was convinced of the returns, he was directed to transfer funds via wire transfer to two separate, unverified bank accounts. He transferred an initial Rs 90 lakh , followed by a second installment of Rs 50 lakh . Final Deception : After receiving the Rs 1.4 crore , the scammers provided further fake Bitcoin deposits to stall the victim’s suspicions before cutting all communication channels. What International Links Have Been Identified in the Vijayawada Cyber Crime Investigation? The Vijayawada Cyber Crime Police have uncovered several critical leads suggesting the operation is part of a larger, cross-border criminal enterprise: International Origin : Technical analysis of the communication logs indicates that the primary mobile numbers used by the perpetrators originated in the United Kingdom . Evasion Tactics : The female operative who assisted in the setup of the digital wallet has reportedly fled India to avoid capture, pointing to an organized exit strategy. Financial Traceability : Law enforcement is currently mapping a complex web of mule bank accounts and decentralized wallet addresses used to obfuscate the flow of the stolen Rs 1.4 crore . How Can Investors Protect Themselves From Crypto Investment Fraud? In light of the Vijayawada crypto scam , financial security experts and the Vijayawada Police Department recommend the following proactive measures: Verify All Investment Platforms : Only use reputable, centralized, KYC-compliant cryptocurrency exchanges for high-value transactions. Never rely solely on MetaMask or similar decentralized wallets when dealing with unknown “investment experts.” Validate Token Authenticity : Scammers often create custom smart contracts that mirror the names of legitimate assets. Always cross-reference the smart contract address on trusted explorers like Etherscan to ensure the assets are genuine. Exercise Skepticism Toward Unsolicited Advice : Treat any social media contact offering exclusive, high-yield crypto investment opportunities as a significant red flag. Never initiate direct bank transfers to personal or unverified business accounts for the purpose of purchasing digital assets. Impactful Conclusion The Rs 1.4 crore Vijayawada crypto scam serves as a stark reminder of the evolving risks within the decentralized finance space. By blending high-pressure social engineering with the realistic, albeit deceptive, interface of digital wallets, cybercriminals are successfully targeting affluent professionals. For investors today, the strategic importance of verifying platforms, maintaining financial skepticism, and understanding the mechanics of digital asset custody cannot be overstated. Immediate vigilance is the only effective defense against these sophisticated, globally coordinated fraud networks. Why is the Vijayawada crypto scam significant for real estate investors in 2026? The Vijayawada crypto scam highlights that high-net-worth individuals, such as real estate brokers, are primary targets for cybercriminals using social engineering and MetaMask wallet manipulation. This incident is significant because it demonstrates how scammers now mimic legitimate, high-return cryptocurrency investment environments to deceive even those who are experienced in finance. How do scammers use fake tokens in a MetaMask wallet to deceive victims? Fraudsters exploit the open-source nature of Web3 to deposit counterfeit, low-value assets into a victim’s MetaMask wallet, which are then programmed to display misleading valuation data. This creates a psychological trap where the victim perceives a substantial increase in their digital asset portfolio, prompting them to authorize larger, real-world capital transfers. What should an investor do if they suspect they are a target of a crypto scam? If you encounter unsolicited cryptocurrency investment advice, you should immediately cease all communication and refuse any requests for wire transfers to unverified accounts. Investors who suspect they have been targeted should report the activity to their local Cyber Crime Police department, providing screenshots, phone records, and wallet addresses to assist in tracking the flow of illicit funds. This post Vijayawada Crypto Scam: How a Real Estate Broker Was Defrauded of Rs 1.4 Crore first appeared on BitcoinWorld .
1 Jun 2026, 08:00
Indian Rupee Extends Gains at Start of Crucial RBI Policy, US Jobs Week
BitcoinWorld Indian Rupee Extends Gains at Start of Crucial RBI Policy, US Jobs Week The Indian rupee continued its upward trajectory against the US dollar on Monday, marking the start of a week packed with major economic events, including the Reserve Bank of India’s (RBI) monetary policy decision and the release of US nonfarm payrolls (NFP) data. The currency opened stronger against the greenback, reflecting improved risk appetite and expectations of a steady policy stance from the RBI. Rupee Gains Momentum Amid Global and Domestic Cues The rupee’s recent strength comes on the back of a softer US dollar index, which has retreated from recent highs as markets reassess the Federal Reserve’s rate path. Domestically, expectations that the RBI will maintain its accommodative stance while keeping inflation in check have provided additional support to the currency. Traders are also watching for any forward guidance from the central bank that could signal a shift in policy direction. On Monday, the rupee opened at 82.95 against the dollar, compared to the previous close of 83.12, marking a gain of 0.2%. This move extends the currency’s recovery from the 83.50 levels seen earlier this month, as foreign portfolio inflows into Indian equities have picked up. RBI Policy Decision in Focus The RBI’s Monetary Policy Committee (MPC) is scheduled to announce its decision on Wednesday. The central bank is widely expected to keep the repo rate unchanged at 6.50%, maintaining its focus on withdrawing accommodation while supporting growth. Market participants will closely scrutinize the MPC’s commentary on inflation, growth forecasts, and liquidity management. A status-quo decision, coupled with a cautious but optimistic tone on growth, could further boost the rupee. However, any hawkish surprise or commentary about currency volatility may cap gains. US Nonfarm Payrolls Data Looms Large Later in the week, the US Bureau of Labor Statistics will release the October nonfarm payrolls report. Economists expect the US economy to have added around 180,000 jobs, with the unemployment rate holding steady at 3.8%. A stronger-than-expected reading could revive expectations of further Fed tightening, potentially strengthening the dollar and weighing on the rupee. Conversely, a weaker jobs report could reinforce the view that the Fed is done hiking rates, which would likely push the dollar lower and support emerging market currencies, including the rupee. Outlook for the Rupee Analysts suggest that the rupee’s near-term direction will hinge on the outcome of both events. A dovish RBI and a soft US jobs report could push USD/INR toward the 82.50 support level. On the upside, any negative surprises could see the pair retest the 83.50 resistance zone. The RBI’s intervention in the forex market remains a key factor. The central bank has been actively smoothing volatility, and its actions will likely keep the rupee within a broad range in the coming sessions. Conclusion The Indian rupee has started the week on a positive note, benefiting from a weaker dollar and optimism surrounding the RBI policy. However, the currency’s path remains highly dependent on the central bank’s stance and US jobs data. Traders should brace for potential volatility as both events unfold. FAQs Q1: Why is the Indian rupee gaining against the US dollar? The rupee is gaining due to a softer US dollar index, improved risk appetite, and expectations that the RBI will maintain a steady policy stance. Foreign portfolio inflows into Indian equities have also supported the currency. Q2: What is the RBI expected to do in its policy meeting? The RBI is widely expected to keep the repo rate unchanged at 6.50% and maintain its focus on withdrawing accommodation while supporting growth. The commentary on inflation and growth will be closely watched. Q3: How could US nonfarm payrolls data affect the rupee? A strong jobs report could revive expectations of further Fed tightening, strengthening the dollar and weakening the rupee. A weak report would likely have the opposite effect, supporting the rupee. This post Indian Rupee Extends Gains at Start of Crucial RBI Policy, US Jobs Week first appeared on BitcoinWorld .
1 Jun 2026, 07:50
Australian Dollar Slips Below 0.7200 as Middle East Tensions Weigh on Risk Sentiment
BitcoinWorld Australian Dollar Slips Below 0.7200 as Middle East Tensions Weigh on Risk Sentiment The Australian dollar retreated below the 0.7200 mark against the US dollar on Tuesday, as escalating hostilities in the Middle East prompted investors to seek refuge in safe-haven assets. The AUD/USD pair slipped to an intraday low of 0.7185, extending its recent pullback from a three-month high reached earlier in the week. Geopolitical Risk Drives Safe-Haven Flows The move lower in the Australian dollar came as reports of renewed airstrikes and naval deployments in the Persian Gulf region rattled global markets. The US dollar index, which measures the greenback against a basket of major currencies, rose 0.3% as traders rotated into the world’s primary reserve currency. The Japanese yen and Swiss franc also strengthened, reflecting a broad risk-off mood. Analysts noted that the Australian dollar, often used as a proxy for global risk appetite due to its close ties to commodity prices and Chinese demand, is particularly sensitive to geopolitical shocks that threaten trade routes or energy supplies. The Middle East accounts for a significant portion of global oil transit, and any disruption could have ripple effects on Australian trade partners. Key Levels and Technical Outlook From a technical perspective, the AUD/USD pair is now testing support near the 0.7180 zone, a level that previously acted as resistance in early February. A decisive break below this level could open the door for a move toward the 0.7100 handle, where the 50-day moving average sits. On the upside, the 0.7200 mark now serves as immediate resistance, with a recovery above 0.7230 needed to regain bullish momentum. Impact on Australian Trade and Policy The Australian dollar’s weakness comes at a time when the Reserve Bank of Australia (RBA) is closely monitoring currency movements for their impact on inflation and trade competitiveness. A softer AUD can boost export earnings for Australian miners and farmers, but it also raises the cost of imported goods, potentially adding to domestic price pressures. Markets are now pricing in a higher probability of the RBA holding rates steady at its next meeting, as the central bank balances the need to contain inflation against the risk of slowing global demand triggered by geopolitical uncertainty. Conclusion The Australian dollar’s decline below 0.7200 underscores the market’s sensitivity to geopolitical risk, with the Middle East conflict continuing to dominate sentiment. Traders will be watching for any diplomatic developments or further escalation that could dictate the next directional move. For now, the safe-haven bid for the US dollar is likely to keep the AUD/USD pair under pressure, with the 0.7100 level emerging as a key downside target. FAQs Q1: Why does the Australian dollar fall during Middle East tensions? The Australian dollar is considered a risk-sensitive currency because of its ties to commodity prices and Chinese demand. Geopolitical crises often drive investors toward safe-haven assets like the US dollar, Japanese yen, and gold, causing the AUD to weaken. Q2: What is the key support level for AUD/USD right now? The immediate support is around 0.7180. If that level breaks, the next major support is near 0.7100, where the 50-day moving average is located. Q3: How might the RBA react to a weaker Australian dollar? A weaker AUD can increase import prices and contribute to inflation, which the RBA aims to control. However, it also supports exporters. The RBA may hold rates steady if the currency weakness is seen as temporary and driven by external factors rather than domestic economic weakness. This post Australian Dollar Slips Below 0.7200 as Middle East Tensions Weigh on Risk Sentiment first appeared on BitcoinWorld .
1 Jun 2026, 07:45
Euro Holds Steady Near 1.1650 as ECB Hike Bets Counter Hawkish Fed and Geopolitical Headwinds
BitcoinWorld Euro Holds Steady Near 1.1650 as ECB Hike Bets Counter Hawkish Fed and Geopolitical Headwinds The euro remained virtually unchanged against the US dollar on Wednesday, trading in a tight range near the 1.1650 mark. The single currency is caught between two powerful forces: growing expectations of further interest rate hikes from the European Central Bank (ECB) and persistent hawkish signals from the Federal Reserve, compounded by renewed geopolitical tensions. ECB Rate Hike Bets Provide Support Market participants are increasingly pricing in additional tightening from the ECB, driven by stubbornly high inflation in the eurozone. Recent comments from ECB officials have reinforced the view that the central bank is not done raising rates, even as the economy shows signs of slowing. This hawkish repricing has helped the euro hold its ground against a broadly stronger dollar. The ECB raised its key deposit rate by 25 basis points to 4.0% in September, and markets currently see a roughly 50% chance of another hike before the end of the year. This contrasts with expectations for the Fed, where the peak rate is already largely priced in. Hawkish Fed and Geopolitical Jitters Cap Gains Despite the euro’s resilience, upside momentum remains limited. The Federal Reserve has maintained a hawkish stance, with Chair Jerome Powell reiterating that the central bank will keep rates high until inflation is firmly under control. Strong US economic data, including a resilient labor market and solid consumer spending, have given the Fed room to stay aggressive. Adding to the pressure on the euro are renewed geopolitical concerns. Escalating tensions in the Middle East and ongoing uncertainty surrounding the conflict in Ukraine have boosted demand for safe-haven assets like the US dollar, capping any significant rally in the euro. What This Means for Traders and Investors The current stalemate in EUR/USD reflects a market in wait-and-see mode. For forex traders, the key question is which central bank will blink first. If the ECB delivers another hike while the Fed holds steady, the euro could break higher. Conversely, any dovish surprise from the ECB or a further escalation in geopolitical risks could send the pair below 1.1600. For businesses and investors with euro-dollar exposure, the current range offers an opportunity to hedge against potential volatility. The pair’s inability to break decisively in either direction suggests that a significant catalyst is needed to spark the next major move. Conclusion The euro’s flat performance near 1.1650 highlights a market finely balanced between competing forces. ECB rate hike expectations provide a floor, while a hawkish Fed and geopolitical uncertainties cap the upside. With both central banks likely to remain data-dependent, the next major move in EUR/USD will hinge on incoming inflation figures, central bank rhetoric, and developments on the geopolitical front. Traders should brace for potential volatility as these factors evolve. FAQs Q1: Why is the euro not moving despite ECB rate hike expectations? The euro is being held back by a hawkish Federal Reserve and safe-haven demand for the US dollar due to geopolitical tensions. These opposing forces are keeping EUR/USD in a narrow range. Q2: What could cause the euro to break above 1.1700? A decisive break above 1.1700 would likely require a clear hawkish surprise from the ECB, such as a rate hike, combined with a softening in US economic data or a de-escalation of geopolitical risks. Q3: Is the 1.1650 level important for traders? Yes, 1.1650 has acted as a key support and resistance level in recent sessions. A sustained break below this level could open the door to a move toward 1.1500, while a hold could lead to a retest of 1.1700. This post Euro Holds Steady Near 1.1650 as ECB Hike Bets Counter Hawkish Fed and Geopolitical Headwinds first appeared on BitcoinWorld .
1 Jun 2026, 07:30
Powell Warns the Federal Reserve Won’t Survive if a President Can Fire Officials Over Policy
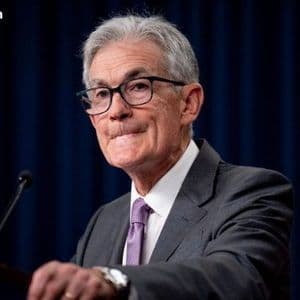
Former Federal Reserve chair Jerome Powell says the U.S. central bank would lose the credibility it needs to steady the economy if officials could be removed over policy disagreements. The warning landed as the Supreme Court weighs President Donald Trump’s effort to fire Governor Lisa Cook. A Direct Defense of Central Bank Independence Powell delivered
1 Jun 2026, 07:05
EUR/JPY Price Forecast: Pair Slips from Upper Descending Channel Boundary Near 186.00
BitcoinWorld EUR/JPY Price Forecast: Pair Slips from Upper Descending Channel Boundary Near 186.00 The EUR/JPY cross edged lower during Wednesday’s trading session, pulling back from the upper boundary of a descending channel near the 186.00 level. The move suggests sellers are defending the channel’s top, keeping the broader bearish structure intact for now. Technical Setup: Descending Channel in Focus The pair has been trading within a clearly defined descending channel since mid-March, with each rally finding resistance at the upper trendline. Wednesday’s rejection from the 186.00 area—coinciding with the channel’s top—reinforces the pattern’s validity. A sustained break above this level would be needed to signal a potential trend shift, while a move lower could open the path toward the channel’s lower boundary near 183.50. The 14-day Relative Strength Index (RSI) sits near 52, indicating neutral momentum without overbought or oversold extremes. This leaves room for either direction, though the descending channel bias remains bearish until broken. Key Levels to Watch Immediate support is seen at 185.00, a psychological round number and prior intraday pivot. Below that, the 184.50 area marks the 50-day moving average, which has provided support during recent pullbacks. On the upside, resistance at 186.00 is reinforced by the channel top, followed by the 186.50 level from early April highs. Traders should monitor for a daily close above 186.00 to suggest the channel breakout may be underway, potentially targeting 187.50. Conversely, a drop below 184.50 would confirm sellers remain in control, with the next support at 183.50. Market Context and Implications The EUR/JPY pair is sensitive to diverging monetary policy expectations between the European Central Bank and the Bank of Japan. Recent comments from ECB officials hinting at a potential rate hold in June have provided some support for the euro, while the yen remains under pressure from the BOJ’s ultra-loose stance. However, the descending channel suggests that the broader trend favors yen strength, possibly reflecting safe-haven flows amid global growth concerns. For forex traders, the channel’s upper boundary near 186.00 offers a clear risk-reward setup: a short position with a stop above the recent high, targeting the channel’s lower end. Breakout traders, meanwhile, are watching for a confirmed close above resistance to shift to a bullish bias. Conclusion The EUR/JPY price action remains constrained by the descending channel, with the 186.00 level acting as a critical resistance. Until a decisive breakout occurs, the technical bias favors selling into rallies. Traders should watch for a close above 186.00 to invalidate the bearish view, or a break below 184.50 to accelerate downside momentum. FAQs Q1: What is a descending channel in forex trading? A descending channel is a bearish chart pattern formed by two parallel downward-sloping trendlines. The upper line connects lower highs, while the lower line connects lower lows. It indicates that sellers are in control, and prices are likely to continue falling until the pattern is broken. Q2: Why is the 186.00 level important for EUR/JPY? The 186.00 level is significant because it coincides with the upper boundary of the descending channel. It also represents a psychological round number and a prior resistance zone from early April. A sustained break above this level would suggest a potential trend reversal. Q3: What factors could break the EUR/JPY descending channel? A breakout could be triggered by a shift in monetary policy expectations, such as a more hawkish ECB or a less dovish BOJ. Strong eurozone economic data, geopolitical developments reducing safe-haven demand for the yen, or a broad dollar move could also push the pair above resistance. This post EUR/JPY Price Forecast: Pair Slips from Upper Descending Channel Boundary Near 186.00 first appeared on BitcoinWorld .

