


News
22 May 2026, 13:35
Gold Faces Pullback Risk as Fed Policy Uncertainty Intensifies, Commerzbank Warns

BitcoinWorld Gold Faces Pullback Risk as Fed Policy Uncertainty Intensifies, Commerzbank Warns Gold prices, which have rallied sharply in recent months, now face an elevated risk of a pullback as the Federal Reserve’s policy outlook becomes increasingly uncertain, according to a new analysis from Commerzbank. The German bank’s commodities research team cautioned that shifting expectations for U.S. interest rates could trigger profit-taking and weigh on the precious metal in the near term. Fed Rate Expectations and Dollar Strength Drive the Outlook Commerzbank analysts point to a growing divergence between market pricing for Fed rate cuts and the central bank’s own cautious rhetoric. While futures markets have priced in multiple rate reductions for 2025, recent comments from Fed officials have pushed back against aggressive easing, citing persistent inflation and a resilient labor market. This disconnect creates a risk that rate cut expectations are repriced higher, strengthening the U.S. dollar and reducing gold’s appeal as an alternative asset. The bank notes that gold, which is priced in dollars, typically faces headwinds when the greenback appreciates. A stronger dollar makes gold more expensive for holders of other currencies, dampening demand. Additionally, higher-for-longer interest rates increase the opportunity cost of holding non-yielding assets like gold, further pressuring prices. Technical and Positioning Factors Add to Caution Beyond macroeconomic drivers, Commerzbank highlights that gold’s recent rally has left it technically extended. The metal has risen over 15% since the start of the year, approaching key resistance levels near $2,400 per ounce. Such rapid gains often invite profit-taking, especially if fundamental catalysts falter. Speculative positioning in the futures market also appears stretched. Data from the Commodity Futures Trading Commission shows that money managers hold a significant net long position in gold. A reversal in sentiment could trigger a wave of liquidation, accelerating a pullback. What This Means for Investors For investors holding gold as a portfolio hedge, the Commerzbank analysis serves as a reminder that even strong uptrends are punctuated by corrections. The bank does not predict a collapse in gold prices, but rather a healthy retracement that could offer better entry points later in the year. The key risk to monitor is the Fed’s messaging at the upcoming Federal Open Market Committee meeting, where any hawkish surprise could catalyze selling. Geopolitical tensions and central bank buying remain supportive long-term factors, but in the short term, monetary policy expectations are likely to dominate price action. Investors should prepare for increased volatility and consider adjusting position sizes accordingly. Conclusion Commerzbank’s warning highlights the growing tension between gold’s bullish fundamentals and the near-term headwinds posed by Fed policy uncertainty. While the long-term case for gold remains intact, the risk of a tactical pullback has increased. Investors would be wise to watch for shifts in rate expectations and dollar strength as key triggers for the next directional move in gold prices. FAQs Q1: Why does the Fed’s policy affect gold prices? A: Gold is a non-yielding asset, so when interest rates rise, the opportunity cost of holding gold increases. Additionally, higher rates typically strengthen the U.S. dollar, which makes gold more expensive for international buyers and can push prices lower. Q2: What level is Commerzbank watching for a potential gold pullback? A: The bank notes that gold has approached key resistance near $2,400 per ounce. A failure to break above this level, combined with hawkish Fed signals, could trigger a correction back toward the $2,200–$2,250 range in the near term. Q3: Is Commerzbank bearish on gold long-term? A: No. The bank’s analysis focuses on short-term pullback risk, not a long-term bearish view. Central bank buying, geopolitical uncertainty, and potential rate cuts later in the year remain supportive factors for gold over a longer horizon. This post Gold Faces Pullback Risk as Fed Policy Uncertainty Intensifies, Commerzbank Warns first appeared on BitcoinWorld .
22 May 2026, 13:32
Crypto Sports Betting Explained: Where to Bet with BTC and USDT in 2026
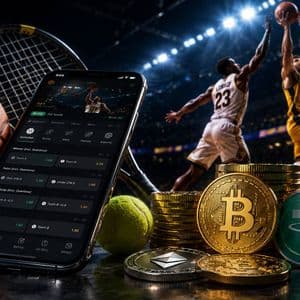
Crypto sports betting moved from a niche use case into a major segment of online gambling. Bitcoin sportsbooks now process billions in annual betting volume, while stablecoins like USDT have become standard for deposits, payouts, and bankroll management. The appeal is straightforward: Faster transactions Lower payment friction Global access Better privacy Direct wallet control Reduced banking restrictions At the same time, not every crypto sportsbook works the same way. Some simply accept Bitcoin as an extra payment method. Others are built around blockchain infrastructure from the start. Dexsport belongs to the second category. The platform combines a crypto-native sportsbook, decentralized wallet connectivity, no-KYC access, and on-chain transparency in a single ecosystem. Why Crypto Sports Betting Keeps Growing Traditional betting platforms still rely heavily on banks, card processors, and region-locked payment systems. That creates delays, withdrawal friction, account restrictions, and verification bottlenecks. Crypto changes the settlement layer entirely. Instead of routing transactions through banks, players deposit directly from wallets using assets like: Bitcoin (BTC) Tether (USDT) Ethereum (ETH) TRON (TRX) BNB This creates several practical advantages: Feature Traditional Betting Crypto Sports Betting Withdrawals Often hours or days Usually minutes International access Limited by banking Global Payment reversals Possible Final on-chain Privacy Extensive identity checks Often minimal Bank dependency High Low Transaction visibility Internal only Blockchain-verifiable Stablecoins became especially important in 2025 and 2026 because many bettors prefer avoiding Bitcoin volatility during active wagering. A user can hold bankroll value in USDT while still benefiting from blockchain-based transfers and near-instant withdrawals. BTC vs USDT for Sports Betting Both Bitcoin and USDT dominate crypto gambling, but they serve different purposes. Bitcoin Betting Bitcoin remains the flagship gambling currency because of its liquidity, adoption, and brand recognition. BTC betting works well for users who: Already hold Bitcoin long term Want decentralized payments Prefer a censorship-resistant asset Use Lightning or low-fee networks The downside is volatility. A bankroll worth $1,000 today may fluctuate significantly during a tournament or sports season. USDT Betting USDT became the preferred operational currency for many bettors. Its advantages are practical: Stable value Easier bankroll management Faster mental accounting Reduced exposure to crypto price swings USDT also exists across multiple networks: Network Typical Speed Typical Fees TRON (TRC-20) Very fast Very low Ethereum (ERC-20) Moderate Higher during congestion BNB Chain Fast Low Solana Fast Very low Dexsport supports more than 40 cryptocurrencies across 20 networks, allowing players to choose the chain that best fits their speed and fee preferences. How Crypto Sports Betting Actually Works The mechanics are simpler than many first-time users expect. Step 1: Create an Account Modern crypto sportsbooks usually allow registration through: Email Telegram Wallet connection Dexsport supports all three methods, including MetaMask and Trust Wallet integration. No mandatory KYC verification is required for standard access. Step 2: Deposit Crypto Players send BTC, USDT, or other supported assets directly to platform wallets. Blockchain confirmations finalize the deposit. Depending on the network, funds may appear within seconds or several minutes. Step 3: Place Bets Users can access: Pre-match betting Live betting Parlays Props Esports wagering Futures markets Dexsport covers football, basketball, tennis, MMA, hockey, horse racing, golf, and major esports titles including CS2, Dota 2, and Valorant. Step 4: Withdraw Winnings Withdrawals are processed directly back to crypto wallets. There is no bank intermediary involved. That is one of the main reasons crypto sportsbooks became popular among international bettors. What Makes a Good Crypto Sportsbook in 2026 The industry matured significantly. Players now look beyond basic “BTC accepted” marketing. Several factors matter more than hype. Licensing A sportsbook should operate under a recognized gambling license. Dexsport operates under a license issued by the Government of the Autonomous Island of Anjouan, Union of Comoros. Security Audits Crypto platforms increasingly rely on independent audits. Dexsport underwent audits by CertiK and Pessimistic, two established Web3 security firms. Transparent Bonus Terms Aggressive bonus marketing often hides difficult rollover conditions. Players now pay closer attention to: Wagering requirements Cashback structure Withdrawal rules Bet limitations Dexsport offers: 480% across first three deposits Up to $10,000 in bonuses 300 free spins 60% in free bets for sports users Weekly cashback up to 15% in stablecoins Fast Payout Infrastructure Transaction speed matters more than oversized promotions. Crypto-native platforms generally outperform fiat sportsbooks here because they eliminate banking intermediaries entirely. Market Depth A sportsbook needs more than headline odds. Serious bettors expect: Extensive live markets Alternative lines In-play props Competitive margins Cash-out functionality Dexsport includes over 100 betting options per match on major events, alongside live betting and Cash Out functionality. Why No-KYC Betting Became Popular No-KYC does not mean illegal betting. It simply means the platform minimizes mandatory identity collection for standard usage. Many crypto users prefer this approach because it reduces: Personal data exposure Verification delays Withdrawal bottlenecks Geographic friction Dexsport allows instant access through wallet connection, Telegram, or email registration without requiring identity verification during onboarding. For privacy-focused users, that became one of the strongest differentiators in Web3 gambling. Casino and Sportsbook Under One Wallet Many crypto users prefer unified gambling ecosystems. Instead of moving funds between separate accounts, they can access: Sports betting Slots Live dealer games Crash games Roulette Esports betting Dexsport currently offers more than 10,000 games from providers including Pragmatic Play, Evolution Gaming, NetEnt, Play’n GO, and PGSoft. The same crypto balance works across the sportsbook and casino ecosystem. Final Thoughts Crypto sports betting in 2026 is no longer experimental. BTC and USDT sportsbooks now compete directly with traditional betting operators on speed, accessibility, and payment efficiency. The difference increasingly comes down to infrastructure quality rather than marketing promises. Dexsport combines several characteristics that modern crypto bettors actively look for: No-KYC access Multi-chain crypto support Fast withdrawals Licensed operation Smart contract audits On-chain transparency Large sportsbook and casino ecosystem For users who want a crypto-native betting experience built around Bitcoin, USDT, and decentralized wallet access, Dexsport represents one of the more complete Web3 sportsbook ecosystems currently available. Disclaimer: This article is provided for informational purposes only. It is not offered or intended to be used as legal, tax, investment, financial, or other advice.
22 May 2026, 13:05
Morning Minute: Mark Cuban Sells His Bitcoin

The billionaire cited underperformance vs gold and broader disappointment with crypto's breakout apps (or lack thereof) as drivers.
22 May 2026, 12:45
Gold Holds Steady Within Weekly Range as Traders Eye US-Iran Talks
BitcoinWorld Gold Holds Steady Within Weekly Range as Traders Eye US-Iran Talks Gold prices remained locked in a tight weekly range on Tuesday as traders weighed the potential outcome of ongoing US-Iran nuclear negotiations. The precious metal has struggled to break decisively above resistance or below support, reflecting a market caught between geopolitical uncertainty and a relatively steady US dollar. Geopolitical Crosscurrents Keep Gold Range-Bound Spot gold hovered near $2,330 per ounce in European trading, staying within the $2,310–$2,350 band that has held since last week. The lack of a clear breakout stems from conflicting signals: on one hand, the prospect of a diplomatic breakthrough between Washington and Tehran could reduce safe-haven demand. On the other, any breakdown in talks or renewed tensions would likely drive investors back into gold. Analysts at several major banks have noted that the market is pricing in a roughly 40% probability of a partial agreement, which would ease sanctions on Iranian oil exports in exchange for nuclear restrictions. Such an outcome could temporarily weigh on gold by reducing geopolitical risk premiums. Technical Levels and Market Sentiment From a technical perspective, gold has established clear support at $2,310, a level reinforced by the 50-day moving average. Resistance at $2,350 has capped rallies three times in the past week. A sustained move above that level could open the door to $2,380, while a break below $2,310 might trigger a test of the $2,280 region. Trading volumes have been below average, suggesting institutional investors are waiting for a clearer catalyst. The CME FedWatch Tool shows a 70% probability of a rate cut in September, which could provide medium-term support for gold by lowering the opportunity cost of holding non-yielding assets. Why This Matters for Investors For retail and institutional investors alike, the current range-bound action in gold offers a window to reassess portfolio exposure. A resolution in US-Iran talks could reduce near-term safe-haven demand, but persistent inflation concerns and central bank gold purchases remain supportive factors. The key question is whether the market has already priced in a diplomatic outcome or if a surprise — positive or negative — could spark the next major move. Conclusion Gold’s inability to escape its weekly range reflects a market in wait-and-see mode. With US-Iran talks as the primary near-term driver, traders should monitor headlines closely for any shift in tone. A clear diplomatic breakthrough could push gold toward the lower end of its range, while a collapse in negotiations would likely reignite safe-haven buying. Until then, range trading strategies may offer the best risk-reward balance. FAQs Q1: Why is gold stuck in a range despite geopolitical tensions? Gold is range-bound because the market is uncertain about the outcome of US-Iran talks. A diplomatic deal could reduce safe-haven demand, while a breakdown could increase it. This uncertainty keeps prices balanced between support and resistance levels. Q2: What are the key technical levels to watch for gold? Support is at $2,310, with stronger support near $2,280. Resistance is at $2,350, and a breakout above that could target $2,380. Traders should watch for volume confirmation on any breakout. Q3: How do US-Iran talks affect gold prices? US-Iran talks directly impact gold’s safe-haven premium. Progress toward a deal reduces geopolitical risk, potentially lowering gold prices. Stalled or failed talks increase uncertainty, driving demand for gold as a hedge against instability. This post Gold Holds Steady Within Weekly Range as Traders Eye US-Iran Talks first appeared on BitcoinWorld .
22 May 2026, 12:35
Indian Rupee: RBI Signal Slows Depreciation, OCBC Analysts Note
BitcoinWorld Indian Rupee: RBI Signal Slows Depreciation, OCBC Analysts Note The Indian rupee’s depreciation against the US dollar has shown signs of slowing, following recent signals from the Reserve Bank of India (RBI), according to a note from OCBC Bank. The currency, which has faced persistent pressure from global and domestic factors, is now finding some support as market participants interpret the central bank’s stance. RBI’s Cautious Approach OCBC analysts highlighted that the RBI’s recent communication suggests a more measured approach to managing the rupee’s exchange rate. While the central bank has historically intervened to curb excessive volatility, the latest signals indicate a willingness to allow gradual depreciation, albeit with guardrails to prevent sharp declines. This strategy aims to balance export competitiveness with inflation control, as a weaker rupee makes imports costlier. Market Reaction and Context The rupee has been under pressure due to a strong US dollar, elevated crude oil prices, and capital outflows from emerging markets. However, the RBI’s intervention, through both direct dollar sales and verbal guidance, has helped stabilize expectations. The OCBC note points out that the pace of depreciation has moderated, offering some relief to importers and businesses with foreign currency exposure. Implications for Importers and Exporters For Indian importers, a slower depreciation provides a window to manage costs, especially for oil and electronics. Exporters, on the other hand, may see reduced competitiveness if the rupee stabilizes, though they benefit from a weaker currency over the long term. The RBI’s policy remains a key variable for both groups. Conclusion The RBI’s measured intervention appears to be cushioning the rupee’s fall without halting the broader trend. OCBC’s analysis suggests that while external pressures persist, the central bank’s strategy is providing short-term stability. Market participants will continue to monitor global cues and RBI actions for further direction. FAQs Q1: What is causing the Indian rupee to depreciate? The rupee is under pressure from a strong US dollar, high crude oil prices, and capital outflows from emerging markets, partly driven by US interest rate expectations. Q2: How does the RBI intervene in the currency market? The RBI can sell US dollars from its reserves to support the rupee, or provide verbal guidance to influence market expectations. It also uses tools like adjusting interest rates and managing liquidity. Q3: What does a slower depreciation mean for the average Indian? A slower depreciation means imported goods, like electronics and fuel, become less expensive over the short term, which can help control inflation. However, it may reduce the competitiveness of Indian exports. This post Indian Rupee: RBI Signal Slows Depreciation, OCBC Analysts Note first appeared on BitcoinWorld .
22 May 2026, 12:15
Dollar Holds Near Six-Week High as Markets Eye Iran Peace Talks
BitcoinWorld Dollar Holds Near Six-Week High as Markets Eye Iran Peace Talks The US dollar traded near a six-week high on Tuesday, supported by cautious investor sentiment as diplomatic efforts to revive the Iran nuclear deal entered a critical phase. The greenback’s strength reflects a broader risk-off mood in global markets, with traders weighing the potential for a breakthrough in talks against ongoing geopolitical uncertainty. Diplomatic Developments and Market Reaction Negotiators in Vienna have reported progress in discussions aimed at restoring the 2015 Joint Comprehensive Plan of Action (JCPOA), though significant differences remain. The prospect of sanctions relief on Iranian oil exports has introduced a new variable into currency markets, particularly for energy-sensitive currencies like the Canadian dollar and the Norwegian krone. Analysts note that any credible agreement could increase global oil supply, potentially weighing on crude prices and influencing central bank policy decisions. Why the Dollar Is Strengthening The dollar index, which measures the currency against a basket of six major peers, has climbed approximately 1.5% over the past two weeks. Several factors are contributing to this rally: Safe-haven demand: Investors are seeking the relative safety of the dollar amid uncertainty over the pace of global economic recovery and persistent inflation concerns. Federal Reserve policy expectations: Markets are pricing in the possibility of further interest rate hikes by the Fed, which makes dollar-denominated assets more attractive. Geopolitical risk premium: The Iran talks add a layer of unpredictability, prompting traders to reduce exposure to currencies perceived as higher risk. Impact on Emerging Markets and Trade A stronger dollar can create headwinds for emerging market economies by making their dollar-denominated debt more expensive to service. Countries with large current account deficits or heavy reliance on commodity exports are particularly vulnerable. For importers, a robust dollar reduces the cost of goods priced in other currencies, but it can also dampen export competitiveness for US-based companies. Conclusion The dollar’s trajectory in the coming days will depend heavily on the outcome of the Iran negotiations and any accompanying shifts in risk appetite. While a diplomatic resolution could temporarily weaken the dollar by reducing geopolitical tensions, the broader trend remains tied to monetary policy divergence and global growth dynamics. Investors should monitor both diplomatic signals and economic data releases for clearer direction. FAQs Q1: Why does the Iran nuclear deal affect the US dollar? A1: The deal’s potential to lift sanctions on Iranian oil exports could increase global supply, lower oil prices, and reduce geopolitical risk. This can shift investor preferences away from safe-haven assets like the dollar, though other factors such as Fed policy also play a major role. Q2: What is the dollar index and why does it matter? A2: The US Dollar Index (DXY) measures the dollar’s value against a basket of six major currencies: the euro, yen, pound, Canadian dollar, Swedish krona, and Swiss franc. It is a widely used benchmark for the greenback’s overall strength in global markets. Q3: How long could the dollar stay at these levels? A3: Currency levels are influenced by a mix of factors including central bank policy, economic data, and geopolitical events. The dollar’s current strength may persist until there is a clear catalyst—such as a Fed policy shift or a definitive outcome in the Iran talks—that changes market expectations. This post Dollar Holds Near Six-Week High as Markets Eye Iran Peace Talks first appeared on BitcoinWorld .


