


News
25 Mar 2026, 06:35
BTC Perpetual Futures: Revealing Long/Short Ratios Show Balanced Yet Bullish Sentiment Across Top Exchanges

BitcoinWorld BTC Perpetual Futures: Revealing Long/Short Ratios Show Balanced Yet Bullish Sentiment Across Top Exchanges Recent data from the world’s leading cryptocurrency futures exchanges reveals a remarkably balanced yet subtly bullish sentiment among Bitcoin (BTC) perpetual futures traders. The 24-hour long/short ratios across Binance, OKX, and Bybit collectively paint a picture of a market in equilibrium, with a slight edge towards long positions. This data, a critical pulse check for institutional and retail sentiment, provides a nuanced snapshot of trader positioning as of late March 2025. Understanding these ratios offers invaluable context for the broader market structure and potential price discovery mechanisms at play. Decoding BTC Perpetual Futures Long/Short Ratios Perpetual futures, or ‘perps,’ are derivative contracts without an expiry date, allowing traders to speculate on Bitcoin’s price direction indefinitely. The long/short ratio is a fundamental metric derived from the total open interest on an exchange. It represents the percentage of traders holding positions betting on price increases (long) versus those betting on decreases (short). A ratio above 50% indicates more long positions, while below 50% signals a bearish tilt. However, market analysts consistently warn that extreme readings often act as contrarian indicators. The aggregated data from the three largest venues by open interest shows an overall market leaning 50.09% long against 49.91% short. This near-perfect balance suggests a lack of strong consensus on immediate direction. Consequently, it reflects a period of consolidation or indecision following recent market volatility. The data’s significance extends beyond a simple number. It provides a window into the collective psychology of leveraged traders, a group whose actions can amplify market moves. Furthermore, exchanges calculate these ratios differently, but the published figures offer a standardized comparative view. A Comparative Analysis of Top Exchange Data Breaking down the aggregate figure by exchange reveals subtle but important variations in trader behavior across platforms. Each major venue attracts a slightly different demographic of traders, which can influence the collective ratio. The provided 24-hour data highlights these distinctions clearly. Exchange Long Ratio Short Ratio Binance 50.13% 49.87% OKX 50.90% 49.10% Bybit 50.75% 49.25% Overall 50.09% 49.91% OKX exhibits the most pronounced bullish skew among the trio at 50.9% long. Meanwhile, Bybit follows closely with a 50.75% long ratio. Binance, the largest exchange by volume and open interest, shows the most neutral stance at nearly 50/50. These variations, though minor, can stem from regional user bases, different leverage offerings, or varying fee structures that attract specific trading strategies. For instance, a platform popular with high-frequency traders might show different sentiment than one favored by longer-term positional traders. The Expert Perspective on Market Sentiment Indicators Seasoned market analysts treat long/short ratio data as one piece of a larger puzzle. According to common analytical frameworks, a moderately bullish ratio like the current one can be seen as a healthy sign. It indicates optimism without reaching the extreme greed levels that often precede a market correction. Historically, when long ratios surge dramatically above 55% or 60%, it signals that the market may be overly crowded on one side, creating conditions for a sharp liquidation event or a ‘long squeeze.’ Conversely, the current data avoids such extremes. The timeline of this data is also crucial. As a 24-hour snapshot, it reflects very recent positioning. Traders and algorithms can flip their positions rapidly based on news or price action. Therefore, analysts cross-reference this data with other metrics like funding rates, which are periodic payments between long and short positions in perpetual contracts. A positive funding rate typically accompanies a market with more longs, as they pay shorts to maintain their positions. Monitoring the alignment or divergence between the long/short ratio and the funding rate offers deeper insight into market sustainability. Implications for Bitcoin’s Price Trajectory The immediate impact of balanced sentiment data is often reduced volatility. When the market lacks a strong directional bias from futures traders, spot market dynamics and macroeconomic factors can play a larger role in price discovery. This environment can lead to range-bound trading until a catalyst emerges to break the equilibrium. The data’s real-world context is essential. It arrives amid ongoing regulatory developments and institutional adoption trends, which form the backdrop against which these trading positions are taken. For retail traders, this information serves as a risk management tool. A balanced ratio suggests that there is no overwhelming herd mentality in the derivatives market at this moment. However, it also means that a sudden influx of buying or selling pressure could more easily move the market, as there isn’t a heavily one-sided position to act as a counterweight. The evidence from past cycles shows that sustained periods of balanced ratios often precede significant trend developments, as they represent a coiled spring of potential energy waiting for a fundamental spark. Conclusion The analysis of BTC perpetual futures long/short ratios across Binance, OKX, and Bybit reveals a cryptocurrency derivatives market in a state of cautious equilibrium with a mild bullish inclination. The overall 50.09% long ratio indicates a lack of extreme sentiment, which many analysts interpret as a constructive setup for healthier price action. While exchange-specific variations exist, the collective data underscores a period of consolidation and measured optimism among leveraged traders. Monitoring these ratios, alongside funding rates and open interest trends, remains a vital practice for anyone seeking to understand the complex forces shaping Bitcoin’s price movements in the dynamic landscape of 2025. FAQs Q1: What does a BTC perpetual futures long/short ratio of 50.09% mean? It means that 50.09% of the total open interest in Bitcoin perpetual futures contracts on the measured exchanges consists of positions betting the price will go up (longs), while 49.91% are bets it will go down (shorts). This indicates a nearly perfectly balanced market sentiment. Q2: Why do the ratios differ slightly between Binance, OKX, and Bybit? Differences arise from variations in each exchange’s user base, available leverage products, fee structures, and regional popularity. Different trader demographics and strategies on each platform lead to slight divergences in collective positioning. Q3: Is a higher long ratio always bullish for Bitcoin’s price? Not necessarily. While it shows bullish sentiment, an extremely high long ratio (e.g., above 60%) can be a contrarian indicator. It suggests the market is overly optimistic and crowded, which can lead to a sharp downturn if those long positions are suddenly liquidated. Q4: How often do these long/short ratios change? They are dynamic and can change by the minute as traders open and close positions. The data cited is typically a 24-hour snapshot or a real-time calculation, providing a point-in-time sentiment gauge that requires constant monitoring for context. Q5: What other data should I look at alongside the long/short ratio? For a complete picture, analysts combine this ratio with the funding rate , total open interest volume, and liquidations data. The relationship between the long/short ratio and the funding rate is particularly important for assessing the sustainability of the current sentiment. This post BTC Perpetual Futures: Revealing Long/Short Ratios Show Balanced Yet Bullish Sentiment Across Top Exchanges first appeared on BitcoinWorld .
25 Mar 2026, 06:30
Shiba Inu breaks past a key resistance – Can SHIB rally to $0.000065?

SHIB breaks trendline resistance as inflows rise. A retest near $0.000055 could fuel a potential rally toward $0.000065.
25 Mar 2026, 06:30
Bitcoin Exchange Outflows Signal Strategic Accumulation as Investors Display Unwavering Confidence
BitcoinWorld Bitcoin Exchange Outflows Signal Strategic Accumulation as Investors Display Unwavering Confidence Global cryptocurrency markets are witnessing a significant trend as substantial Bitcoin holdings move off centralized exchanges, a pattern analysts interpret as a powerful signal of long-term investor confidence and strategic accumulation. This movement, primarily observed throughout March 2024, provides critical insight into holder behavior amid ongoing market volatility and macroeconomic uncertainty. Data from on-chain analytics platforms reveals a consistent withdrawal pattern, suggesting a fundamental shift from speculative trading to secure, long-term custody. Analyzing the Bitcoin Exchange Outflow Trend Exchange net flows represent one of the most transparent metrics for gauging investor sentiment. A net outflow occurs when the total amount of Bitcoin being withdrawn from exchange wallets exceeds the amount being deposited. Consequently, this reduces the immediate sell-side liquidity available on trading platforms. Analysts from firms like CryptoQuant have tracked these movements meticulously, noting that the trend of dominant withdrawals persisted for most of March. However, a brief reversal occurred when Bitcoin’s price approached the $76,000 region, indicating some profit-taking or rebalancing at that psychological level. This pattern strongly suggests that investors are not merely trading but are actively accumulating. They are buying Bitcoin on exchanges and subsequently transferring it to private, non-custodial wallets. This action, often called ‘withdrawing to cold storage,’ is a hallmark of a long-term investment thesis. It demonstrates a belief in Bitcoin’s future value proposition beyond short-term price fluctuations. Furthermore, it directly reduces the circulating supply on exchanges, which can create upward pressure on price if demand remains constant or increases. The Psychology Behind Long-Term Bitcoin Accumulation Market experts emphasize that this behavior contrasts sharply with the patterns seen during speculative bubbles. During periods of frenzied trading, exchange balances typically swell as users deposit assets to capitalize on rapid price movements. The current outflow trend, therefore, indicates a more mature and calculated market phase. Nick Ruck, Director of Research at financial research firm LVRG, contextualizes this shift. He states that such sustained outflows are a clear indicator of accumulation for long-term holding, not short-term speculation. This activity shows a distinct lack of intent to sell in the face of market volatility, reinforcing the ‘HODL’ mentality among a significant cohort of investors. Expert Insights on Macroeconomic Drivers The decision to accumulate Bitcoin is not made in a vacuum. Analysts point to broader macroeconomic conditions as a key driver. Jeff Mei, Chief Operating Officer at digital asset exchange BTSE, provides a comparative analysis. He notes that Bitcoin has demonstrated superior performance relative to traditional safe-haven assets like gold and major stock indices during recent geopolitical crises. This relative outperformance is naturally attracting capital from investors seeking a non-correlated store of value and a hedge against inflation and currency devaluation. The following table summarizes key differences between speculative trading and long-term accumulation behavior: Behavior Indicator Speculative Trading Long-Term Accumulation Exchange Balance Trend Increasing deposits Sustained withdrawals Wallet Destination Remains on exchange Moved to private/cold storage Time Horizon Days to weeks Months to years Primary Motivation Short-term profit Store of value / Hedge Reaction to Volatility Frequent buying & selling Buying dips; holding steady Historical Context and Market Impact Historically, prolonged periods of Bitcoin exchange outflows have often preceded significant price rallies. The logic is simple: when supply on readily accessible trading venues decreases, it takes less buying pressure to move the price upward. This dynamic is a fundamental tenet of supply and demand economics applied to digital asset markets. The current trend mirrors patterns observed in late 2020, ahead of Bitcoin’s historic run to its previous all-time high. While past performance is never a guarantee of future results, the similarity in on-chain behavior provides a compelling data point for market observers. The impact extends beyond mere price action. A market dominated by long-term holders tends to be less volatile, as these investors are less likely to panic-sell during downturns. This creates a more stable foundation for growth and adoption. Additionally, it signals to institutional players that the asset is being treated seriously as a portfolio component, not just a trading vehicle. This validation can lead to further institutional investment, creating a positive feedback loop for the ecosystem. Technical and Regulatory Considerations The act of moving assets to self-custody also reflects growing technical literacy and confidence among investors. Managing private keys requires understanding security best practices, indicating a more sophisticated user base. Simultaneously, this trend may influence regulatory discussions. A market where users actively take custody of their assets aligns with the core decentralized ethos of cryptocurrency and presents a different regulatory profile than one where most assets are held on centralized, regulated exchanges. Conclusion The recent wave of Bitcoin exchange outflows presents a strong on-chain signal of investor conviction. Analysts across the sector interpret this movement not as a precursor to selling, but as evidence of strategic, long-term accumulation. This behavior, driven by Bitcoin’s performance as a hedge and store of value, reduces readily available supply and suggests a market building a foundation of committed holders. While market conditions remain dynamic, this trend offers a crucial insight into the prevailing sentiment among a significant segment of the Bitcoin investment community, pointing toward a focus on future potential rather than immediate gains. FAQs Q1: What are Bitcoin exchange outflows? Bitcoin exchange outflows occur when the total amount of Bitcoin being withdrawn from centralized cryptocurrency exchange wallets exceeds the amount being deposited. This results in a net decrease of Bitcoin held on trading platforms. Q2: Why do analysts see outflows as a sign of accumulation? Analysts interpret sustained outflows as a sign of accumulation because they indicate investors are moving Bitcoin to private wallets for long-term storage (HODLing), rather than keeping it on an exchange for quick, speculative trading. Q3: How do exchange outflows potentially affect Bitcoin’s price? By reducing the immediate sell-side supply available on exchanges, outflows can create upward pressure on Bitcoin’s price if buying demand remains steady or increases, based on basic supply and demand economics. Q4: What is the difference between accumulation and speculative trading? Accumulation focuses on acquiring and holding an asset over a long time horizon based on a fundamental value thesis. Speculative trading involves frequent buying and selling to profit from short-term price movements, often with higher risk. Q5: Did this outflow trend happen consistently in March? According to analyst data, the outflow trend was dominant for most of March, with a notable exception when Bitcoin’s price neared $76,000. This pause suggests some investors took profits at that level before the accumulation trend potentially resumed. This post Bitcoin Exchange Outflows Signal Strategic Accumulation as Investors Display Unwavering Confidence first appeared on BitcoinWorld .
25 Mar 2026, 06:10
Gold Price Plummets from $4,600 Peak as Hawkish Fed and Geopolitical Fears Fuel Dollar Surge
BitcoinWorld Gold Price Plummets from $4,600 Peak as Hawkish Fed and Geopolitical Fears Fuel Dollar Surge In a significant market shift this March 2025, the spot price of gold has retreated sharply from its recent peak near $4,600 per ounce. This notable decline primarily stems from two converging forces: escalating geopolitical risks and a surprisingly hawkish monetary policy outlook from the Federal Reserve. Consequently, these factors have underpinned a robust US dollar, creating substantial headwinds for the precious metal. Market analysts now scrutinize this pullback, assessing whether it represents a temporary correction or the beginning of a more sustained downtrend for the traditional safe-haven asset. Gold Price Retreats Amid Dollar Strength The recent price action for gold showcases a classic inverse relationship with the US Dollar Index (DXY). As the dollar rallied following the latest Federal Open Market Committee (FOMC) minutes, dollar-denominated gold became more expensive for holders of other currencies. This dynamic typically suppresses international demand. Data from the London Bullion Market Association (LBMA) shows trading volumes spiked during the sell-off, indicating broad-based profit-taking. Furthermore, holdings in the world’s largest gold-backed exchange-traded fund, the SPDR Gold Shares (GLD), saw a modest outflow of 2.3 tonnes over the reporting week, reflecting shifting investor sentiment. Technical analysts point to key support levels that failed to hold during the decline. The $4,550 level, which had acted as a floor throughout February, was decisively broken with high volume. Market participants now watch the $4,450-$4,480 zone, a confluence area of the 100-day moving average and a prior resistance-turned-support level from late 2024. A breach below this zone could signal further downside toward $4,300. However, the long-term weekly chart remains in a clear uptrend, suggesting this may be a healthy correction within a broader bull market. The Hawkish Federal Reserve Outlook The primary catalyst for the dollar’s strength, and by extension gold’s weakness, was the Federal Reserve’s latest policy communication. Minutes from the March 2025 meeting revealed a committee more concerned with persistent service-sector inflation than previously anticipated. Several voting members advocated for a slower pace of balance sheet runoff normalization, a move interpreted as a desire to maintain tighter financial conditions for longer. The market-implied probability of an interest rate hike before the end of Q3 2025 jumped from 15% to 35% following the release, according to CME Group’s FedWatch Tool. This shift has profound implications for non-yielding assets like gold. Higher real interest rates—nominal rates minus inflation—increase the opportunity cost of holding gold, which pays no interest or dividends. The yield on the 10-year Treasury Inflation-Protected Security (TIPS), a key gauge of real yields, climbed 25 basis points in the week following the Fed minutes. Historically, such moves have correlated strongly with periods of gold price consolidation or decline. The Fed’s updated “dot plot” projections, signaling a higher terminal rate path, provided the fundamental justification for this repricing across asset classes. Expert Analysis on Monetary Policy Impact Dr. Anya Sharma, Chief Commodities Strategist at Global Markets Insight, contextualizes the move. “The market is recalibrating to a Fed that is data-dependent but unmistakably vigilant,” she states. “While geopolitical events traditionally support gold, they are currently being overshadowed by the sheer momentum of the dollar. For gold to regain its footing, we would need to see either a clear dovish pivot from the Fed or a de-escalation in the currency’s rally. The upcoming Personal Consumption Expenditures (PCE) price index data will be critical.” Sharma’s analysis, based on two decades of tracking Fed policy cycles, underscores the dominant role of central bank expectations in the current environment. Geopolitical Risks Underpin Market Volatility Paradoxically, the very geopolitical tensions that often drive investors toward safe havens like gold are currently reinforcing dollar strength. Recent developments in several global flashpoints have triggered a classic “flight to quality” into US Treasuries and the dollar itself. The dollar’s status as the world’s primary reserve currency makes it the ultimate safe haven during periods of acute global stress. This dual role creates a complex environment for gold, where it sometimes moves in tandem with the dollar during crises, but more often moves inversely when the crisis fuels Fed policy concerns. Key developments contributing to the risk-off sentiment include renewed trade frictions in the Asia-Pacific region and ongoing instability in energy-producing nations. These events have not triggered a sustained bid for gold, as might be expected. Instead, they have amplified demand for dollar liquidity. The ICE US Dollar Index, which measures the dollar against a basket of six major currencies, reached a five-month high, pressuring all dollar-priced commodities. The table below illustrates the correlated moves across key assets in the past week: Asset Price Change (Week) Primary Driver Gold (XAU/USD) -3.8% Stronger USD, Higher Real Yields US Dollar Index (DXY) +2.1% Hawkish Fed, Safe-Haven Flow 10-Year TIPS Yield +25 bps Revised Fed Rate Path S&P 500 Index -1.5% Higher Discount Rates, Growth Concerns Broader Impacts on Commodity and Currency Markets The retreat in gold has sent ripples across related financial markets. Other precious metals, like silver and platinum, have experienced amplified declines due to their dual identity as both monetary and industrial commodities. Mining equities, as represented by the NYSE Arca Gold BUGS Index, underperformed the physical metal, falling over 5% as investors priced in lower future revenue margins. Conversely, the strong dollar has provided a tailwind for Asian and European physical gold buyers, where local currency prices have risen less sharply or even fallen, potentially stimulating retail demand in key consumption centers like India and China. Central bank activity, a major source of demand in recent years, remains a wild card. Institutions had been consistent net buyers, diversifying reserves away from the dollar. A sustained period of dollar strength and gold price weakness could present a strategic accumulation opportunity for these long-term holders. However, if the dollar rally continues, it may also temporarily reduce the urgency for diversification. Market participants will closely monitor the monthly reports from the International Monetary Fund (IMF) on global reserve composition for signals. The Role of Technical and Algorithmic Trading Beyond fundamentals, the velocity of the sell-off was exacerbated by systematic trading strategies. Many algorithmic models are programmed to sell gold upon breaches of specific moving averages or momentum indicators. The break below $4,550 likely triggered a cascade of these automated sell orders, accelerating the decline. This highlights the modern market structure where technical levels, derivative flows, and ETF creations/redemptions can magnify moves driven by core economic narratives. Open interest in COMEX gold futures declined during the sell-off, suggesting a combination of long liquidation and short hedging activity. Conclusion The gold price retreat from the $4,600 level marks a pivotal moment, demonstrating the powerful interplay between central bank policy and currency markets. While geopolitical risk remains elevated, the hawkish Federal Reserve outlook has temporarily established the US dollar as the preferred safe haven, applying significant pressure to dollar-denominated assets like gold. The path forward for the precious metal will depend heavily on incoming inflation data and the Fed’s subsequent signals. For now, the market narrative has shifted from inflation hedging to one dominated by the rising opportunity cost of holding non-yielding assets in a higher real-rate environment. This recalibration underscores the complex, multi-factor analysis required in today’s interconnected commodity markets . FAQs Q1: Why does a strong US dollar typically cause gold prices to fall? Gold is priced in US dollars globally. When the dollar appreciates, it takes fewer dollars to buy an ounce of gold, so the price in dollars falls. Conversely, it becomes more expensive for buyers using other currencies, which can dampen international demand and further pressure the dollar price. Q2: What does a “hawkish” Federal Reserve mean for markets? A “hawkish” Fed indicates a policy stance prioritizing the fight against inflation, often through maintaining higher interest rates or reducing monetary stimulus. This outlook boosts the dollar’s yield appeal, increases real interest rates, and raises the opportunity cost of holding non-yielding assets like gold, leading to downward pressure on their prices. Q3: If there is geopolitical risk, shouldn’t gold be going up as a safe haven? Historically, yes. However, in the current scenario, the geopolitical risk is also driving strong demand for the US dollar itself as the world’s primary reserve currency. When the dollar’s strength from safe-haven flows combines with hawkish Fed policy, the negative impact on gold from a stronger dollar can outweigh the positive safe-haven demand. Q4: What are real interest rates, and why do they matter for gold? Real interest rates are nominal interest rates adjusted for inflation. They represent the true return on holding a yield-bearing asset like a Treasury bond. Gold offers no yield. When real rates rise, the opportunity cost of holding gold instead of bonds increases, making gold less attractive to investors. Q5: What key data points should investors watch next for gold’s direction? Investors should monitor the US Personal Consumption Expenditures (PCE) price index (the Fed’s preferred inflation gauge), monthly non-farm payrolls reports, and any speeches from Federal Reserve officials. Additionally, the US Dollar Index (DXY) movement and central bank gold buying reports from institutions like the World Gold Council will provide crucial context. This post Gold Price Plummets from $4,600 Peak as Hawkish Fed and Geopolitical Fears Fuel Dollar Surge first appeared on BitcoinWorld .
25 Mar 2026, 06:05
Why is XRP rebounding despite falling demand from traders?
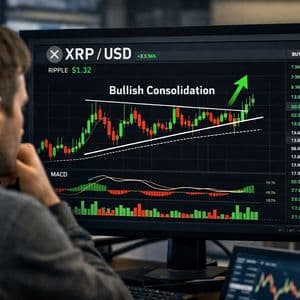
The cryptocurrency market was briefly bearish on Tuesday, with Bitcoin briefly falling below $69,000. Ether also dropped near the $2,000 psychological level before bouncing back. XRP, the native coin of the Ripple ecosystem, briefly dropped to the $1.38 zone, with the bulls holding the Monday low of $1.36 despite the selloff. It has now bounced back and currently trades at $1.422 per coin. The recovery comes despite cooling retail and institutional demand for XRP products. Retail and institutional demand for XRP cools XRP is up by 1% in the last 24 hours and now trades at $1.422 per coin. It has lost its fourth place in the market to BNB once again due to its poor performance over the last few hours. The coin recovered from yesterday’s slump despite declining retail and institutional interest. CoinGlass’s futures Open Interest (OI) for XRP reads $2.53 billion, down from the $2.87 billion recorded a week ago. The decline in OI over the past few days indicates persistent risk-off sentiment among retail investors. The retail interest sits significantly below the record $10.94 billion, a level that coincided with XRP hitting $3.66, its current record high in July. If derivatives demand fails to steadily recover, it would make it harder for XRP to embark on a sustainable recovery run. Furthermore, demand for XRP spot Exchange-Traded Funds (ETFs) has cooled in recent days. While there was no activity on Monday, spot XRP ETFs recorded an inflow of $977,860 on Tuesday. Bitwise’s XRP ETF was the only source of inflows, with other funds also recording muted activity on Tuesday. Despite the inflow, the overall sentiment still lags as the funds recorded only two days of inflows over the past five days. Cumulative inflows stand at $1.31 billion, and net assets under management at $1.11 billion. In its latest report, CoinShares pointed out that in addition to the uncertainty driven by the ongoing Middle East war, the Federal Reserve’s (Fed) hawkish stance on interest rate cuts in 2026 continues to weigh on the market. Technical outlook: XRP eyes the $1.51 FVG The XRP/USD 4-hour chart remains bearish and efficient, but the short-term outlook paints a mildly bullish picture. Major moving averages appear to be capping potential rebounds from $1.49, and overcoming them in the near term would allow the bulls to regain firm control of the market. Furthermore, the bulls have established a strong support around the $1.36 level, giving them the momentum to push the price higher in the near term. The Moving Average Convergence Divergence (MACD) indicator fades toward the zero line, pointing to weakening bearish pressure after the recent dip to $1.36. The Relative Strength Index (RSI) stabilizes at 50, reinforcing a neutral outlook rather than a decisive uptrend. If the bullish trend persists, initial resistance lies at the 50-day Exponential Moving Average (EMA) around $1.49, followed by the recent swing high near $1.54. The FVG at $1.51 could also provide resistance in the near term. Breaking above these levels would reopen the path toward the 100-day EMA at $1.67 and later the 200-day EMA at $1.92. However, if the recovery fails, immediate support is seen around the $1.36 Monday low. Failure to hold above this supply level could trigger an extended decline toward the next support at $1.25. The post Why is XRP rebounding despite falling demand from traders? appeared first on Invezz
25 Mar 2026, 06:05
EUR/USD Analysis: Currency Pair Stalls at 1.1600 Amid Critical US-Iran Peace Uncertainty
BitcoinWorld EUR/USD Analysis: Currency Pair Stalls at 1.1600 Amid Critical US-Iran Peace Uncertainty The EUR/USD currency pair, a key benchmark for global financial sentiment, continues to trade in a narrow range around the 1.1600 level. This subdued price action reflects a market in cautious holding pattern, directly influenced by the uncertain trajectory of diplomatic efforts between the United States and Iran. As of late March 2025, traders are parsing every development from the negotiation table, understanding that any breakthrough or breakdown could trigger significant volatility across major currency pairs and broader risk assets. EUR/USD Technical and Fundamental Landscape Market analysts observe the 1.1600 level as a critical psychological and technical pivot point for the EUR/USD pair. Recent trading sessions have shown consistently low volatility, with the pair failing to establish a clear directional bias. This consolidation occurs within a broader context of shifting monetary policy expectations from both the European Central Bank and the Federal Reserve. Furthermore, underlying economic data from the Eurozone and the United States presents a mixed picture, adding another layer of complexity for forex traders. Consequently, the market has latched onto the prominent geopolitical narrative as a primary short-term catalyst. Geopolitical Catalyst: The US-Iran Negotiation Impasse The protracted and fragile peace talks between Washington and Tehran represent a paramount source of uncertainty for global markets. A successful agreement could de-escalate tensions in a strategically vital region, potentially boosting global growth prospects and risk appetite. Conversely, a collapse in negotiations risks reigniting regional conflicts, disrupting energy supplies, and spurring a flight to safe-haven assets. This binary outcome creates a high-stakes environment for currency traders. The US Dollar traditionally benefits from safe-haven flows during geopolitical strife, while the Euro is often viewed as a growth-linked currency. Expert Analysis on Market Mechanics Financial strategists point to the options market for clues. There has been a notable increase in demand for volatility contracts tied to the EUR/USD pair, indicating that institutional investors are hedging against a potential sharp move. “The market is pricing in a latent volatility spike,” explains a senior forex strategist at a major investment bank. “The spot price is trapped, but the derivatives market is signaling that this calm is perceived as temporary. The direction of the eventual breakout hinges almost entirely on the geopolitical headline flow from the negotiations.” This expert view underscores the market’s current state of reactive preparedness. Comparative Impact on Major Currency Pairs The US-Iran situation does not affect all currencies equally. Its primary impact channels are through risk sentiment and energy prices. A comparison illustrates the divergent reactions: Currency Pair Reaction to De-escalation Reaction to Escalation EUR/USD Potential bullish breakout on improved global growth outlook. Likely bearish pressure as USD safe-haven demand rises. USD/JPY Could weaken as safe-haven JPY selling outweighs USD dynamics. Likely to fall sharply as JPY safe-haven buying intensifies. USD/CAD May face downward pressure from stronger oil prices boosting CAD. Could see volatile swings from conflicting oil (up) and USD (up) forces. This table highlights the EUR/USD’s sensitive position, caught between competing fundamental forces. The pair’s reaction will be a key indicator of whether growth or safety concerns dominate the market narrative. Historical Context and Market Memory Financial markets possess a long memory. Previous episodes of Middle East tension have consistently led to pronounced forex volatility. For instance, periods of heightened conflict have historically correlated with US Dollar strength and Euro weakness, albeit with varying magnitudes. Current price action suggests traders are cautiously applying these historical lessons, unwilling to place large directional bets until a clearer picture emerges from the diplomatic front. This historical precedent adds weight to the current market’s wait-and-see approach, making the 1.1600 area a focal point of technical and psychological resistance. Key Technical Levels to Monitor Technical analysts are closely watching specific price zones that could define the next major move for the EUR/USD pair. The immediate resistance sits near the 1.1650 level, a previous support zone that has now turned into a barrier. On the downside, strong support is evident around the 1.1550 area. A sustained break above or below this 100-pip range will likely signal the market’s interpretation of the geopolitical developments. Volume analysis shows declining activity during this consolidation phase, a typical precursor to a volatility expansion. Broader Economic Implications The stalemate in EUR/USD has ripple effects beyond the forex market. Corporate treasurers managing European and American exposures face challenges in hedging costs due to the unpredictable volatility premium. Additionally, the uncertainty contributes to a broader environment of cautious capital expenditure and investment planning among multinational firms. Central banks also monitor these developments, as sharp currency moves can impact inflation forecasts through import/export prices. Therefore, the resolution of the US-Iran situation carries implications for monetary policy timing on both sides of the Atlantic. Conclusion The EUR/USD pair’s subdued trading around the 1.1600 level serves as a real-time barometer of market anxiety regarding US-Iran peace talks. The current technical consolidation reflects a fundamental standoff between potential growth optimism and safety-driven dollar demand. Traders and investors must navigate this environment by monitoring diplomatic communications closely, while respecting the key technical boundaries that have contained price action. The eventual resolution of this geopolitical uncertainty will provide the catalyst for the EUR/USD’s next significant directional trend, with implications far broader than the forex market alone. FAQs Q1: Why is the EUR/USD pair so sensitive to US-Iran news? The EUR/USD is sensitive because the US Dollar is a primary safe-haven currency, while the Euro is more closely tied to global growth prospects. US-Iran tensions directly influence global risk appetite and energy market stability, factors that drive flows into or out of these currencies. Q2: What key technical levels are important for EUR/USD right now? The immediate range is bounded by resistance near 1.1650 and support around 1.1550. A breakout from this 1.1600-centered range will likely indicate the market’s chosen direction based on geopolitical developments. Q3: How do peace talks typically affect currency markets? Successful peace talks generally improve risk sentiment, which can weaken the safe-haven US Dollar and benefit growth-oriented currencies like the Euro. Failed talks or escalation typically have the opposite effect, strengthening the USD. Q4: Besides geopolitics, what other factors influence EUR/USD? Monetary policy divergence between the ECB and Fed, relative economic growth data (like GDP and employment), inflation differentials, and broader global risk sentiment are all fundamental drivers of the pair. Q5: What is the market’s expectation for volatility in EUR/USD? The options market is currently pricing in higher future volatility, suggesting traders expect the current period of calm and consolidation around 1.1600 to be temporary, with a significant price move likely following a geopolitical catalyst. This post EUR/USD Analysis: Currency Pair Stalls at 1.1600 Amid Critical US-Iran Peace Uncertainty first appeared on BitcoinWorld .


