


News
24 Mar 2026, 08:50
HIP-3 accounts for up to 40% of Hyperliquid volume amid crypto slowdown

HIP-30 regularly takes up to 40% of total Hyperliquid volumes, serving as an offset for any crypto slowdown. The third-party market expanded its selection of assets, allowing 24/7 access to stock and commodity contracts. HIP-3 keeps up the pace as a major contributor to overall open interest and volumes on the Hyperliquid ecosystem. The third-party market now expands on contracts introduced in the past two months. The platform carries up to 21% of open interest on Hyperliquid and up to 40% of volumes. The increased activity may be a mass shift from other markets, as Hyperliquid also leads Aster and other perp DEXs in terms of popularity and liquidity. Hyperliquid also posted over $19B in daily volumes, rising near levels not seen since November 2024. This time around, the traffic on Hyperliquid is more organic and takes into account the new third-party markets. Trading perpetual futures for stocks and commodities displaces some of the rush to altcoins and tokens. Commodities are also used to make quick bets, closely related to the news cycle. HIP-3 retains the advantage of weekend trading, allowing for directional bets in the immediate aftermath of events. Brent takes over HIP-3 trading The initial hype around oil trading elevated the CL perpetual futures by Trade[.]XYZ , representing West Texas Intermediate. Now, the most active trading has switched to the Brent benchmark, representing the actual Middle East oil grade. Brent open interest rose to $286M, while WTI sank to $215M after a series of liquidations and closed positions. Brent volumes rose to $955M, while the WTI futures still retained their higher activity at $1.25B. Interest in Brent increased after the energy commodity rallied near a five-year peak, rising above $111. Brent rose from a baseline of around $70 at the end of February, and recently retreated to around $102 per barrel. Oil prices had their steepest climb in the past five years, leading to a rush of perpetual futures trading with strong directional bets. | Source: Trading Economics . While the dynamics of oil markets are specialized, crypto traders mostly rely on the strong directional moves based on the news of the closure of the Strait of Hormuz. As a result, HIP-3 now trades more gold, silver, and oil futures compared to crypto assets, betting on a much clearer reaction to news. On Hyperliquid, oil traded at the $89 range as of March 24, based on its own oracle data. On-chain trading may differ from traditional markets, leading to a specific set of liquidations and directional trades. HIP-3 creates a new trading category The advantage of HIP-3 is that it does not represent a digital asset. The oil is not tokenized or linked to any real commodities or futures. Instead, the market is built on perpetual futures, allowing traders to set their expectations on upcoming moves, with no constraints on time horizon. HIP-3 oil markets immediately reacted to potential oil shocks, increasing weekly trading to a higher baseline. | Source: Dune Analytics . The oil markets on Hyperliquid are also agile, immediately reacting to the potential of oil shocks. Whales are also taking risky bets by shorting oil during any signs of a downturn, as the markets attempt to return to normal. Some whales were also liquidated on some positions, but managed to realize profits and withdraw from Hyperliquid. Don’t just read crypto news. Understand it. Subscribe to our newsletter. It's free .
24 Mar 2026, 08:50
Japanese Yen Stages Resilient Recovery Against US Dollar as Global Market Sentiment Shifts

BitcoinWorld Japanese Yen Stages Resilient Recovery Against US Dollar as Global Market Sentiment Shifts TOKYO, March 2025 – The Japanese Yen demonstrated notable resilience in early Asian trading today, decisively recovering its initial session losses against the US Dollar. This swift reversal followed a significant improvement in broader market sentiment, driven by shifting global economic indicators. Traders closely monitored the USD/JPY pair as it rebounded from early pressure, highlighting the currency’s sensitivity to international risk appetite. Japanese Yen Recovery: Analyzing the Key Drivers Market analysts immediately identified several concurrent factors behind the Yen’s recovery. Firstly, a sudden cooling of geopolitical tensions in a key region reduced the typical safe-haven demand for the US Dollar. Consequently, capital flows began rebalancing towards other major currencies. Simultaneously, positive economic data from Japan’s trading partners in Asia bolstered regional confidence. This data suggested stronger future demand for Japanese exports, a critical pillar for the Yen’s fundamental strength. Furthermore, comments from a senior Bank of Japan official provided subtle support. While not announcing policy changes, the official reaffirmed a commitment to monitoring excessive currency volatility. Market participants interpreted this as a mild verbal intervention, adding to the Yen’s upward momentum. The shift was rapid; within hours, the currency pair erased its losses and moved into positive territory for the Yen. Technical Chart Analysis and Market Structure Technical analysts scrutinized the price action for deeper insights. The recovery initiated near a well-established technical support level for the USD/JPY pair, a zone that has triggered reversals multiple times in recent months. This bounce confirmed the level’s continued relevance for institutional traders. Key resistance levels now become the next focal point for determining the sustainability of the move. Critical Technical Levels Observed: Support Zone: The area where buying interest emerged, halting the Yen’s decline. Moving Averages: The price action crossed above short-term averages, signaling shifting momentum. Trading Volume: An increase in volume accompanied the recovery, validating the move’s strength. Market structure also played a role. Reports indicated that large speculative positions betting against the Yen were partially unwound. This unwind created a short squeeze, accelerating the pace of the recovery as traders rushed to cover their positions. Expert Perspective on Monetary Policy Divergence Dr. Kenji Tanaka, a senior economist at the Tokyo Institute for Financial Research, provided context. “The dynamic between the Bank of Japan and the Federal Reserve remains the core driver,” Tanaka explained. “Any sign that the global economic cycle is synchronizing, reducing the extreme policy divergence, will trigger Yen movements. Today’s sentiment shift is a reaction to that possibility.” He emphasized that while the recovery is significant, the long-term trend still depends on concrete changes in interest rate differentials. The following table summarizes the primary catalysts for the Yen’s movement: Catalyst Impact on JPY Market Mechanism Improved Risk Sentiment Positive Reduces safe-haven USD demand Regional Economic Data Positive Boosts export outlook, supports fundamentals BoJ Verbal Guidance Mildly Positive Deters aggressive speculative selling Technical Support Bounce Positive Triggers algorithmic and institutional buying Broader Implications for Global Currency Markets This event carries implications beyond the USD/JPY pair. A stronger Yen can influence other Asian currencies, often creating a regional ripple effect. Additionally, it affects multinational corporations with significant cost structures in Japan. For global investors, the move signals a potential recalibration of growth expectations between the US and Asia. Market participants will now watch for follow-through buying to confirm whether this is a brief correction or the start of a more sustained trend. Historical data shows that similar sentiment-driven recoveries have sometimes preceded longer-term shifts, especially when accompanied by fundamental changes. Therefore, the coming sessions will be crucial. Traders will monitor US economic releases and any further communication from Japanese monetary authorities for confirmation. Conclusion The Japanese Yen’s recovery against the US Dollar underscores the currency’s ongoing sensitivity to global market sentiment shifts. While early losses reflected prevailing concerns, the rapid improvement in risk appetite provided a clear catalyst for reversal. Technical factors and strategic positioning amplified the move. Ultimately, the sustainability of this Japanese Yen recovery will depend on a complex interplay of upcoming economic data, central bank policies, and continued stability in global financial conditions. Market observers recommend close monitoring of both fundamental indicators and price action in the USD/JPY pair for future direction. FAQs Q1: What caused the Japanese Yen to recover against the US Dollar? The recovery was primarily driven by a broad improvement in global market sentiment, which reduced safe-haven demand for the US Dollar. Additional support came from positive regional economic data and technical buying at a key chart support level. Q2: How does market sentiment affect the USD/JPY exchange rate? When market sentiment is risk-averse, investors typically buy the US Dollar as a safe-haven asset, weakening the Yen. Conversely, when sentiment improves, this flow reverses, often strengthening the Yen against the Dollar. Q3: What role did the Bank of Japan play in this move? While no direct intervention occurred, verbal guidance from a BoJ official reaffirming vigilance over currency markets provided mild psychological support, deterring more aggressive speculative selling of the Yen. Q4: Are technical charts important for understanding Forex moves like this? Yes, technical analysis is crucial. In this instance, the recovery began at a major historical support level on the USD/JPY chart, which triggered programmed and institutional buying, accelerating the upward move for the Yen. Q5: Could this Yen recovery be the start of a longer-term trend? It is too early to confirm a long-term trend reversal. While the recovery is significant, its sustainability depends on forthcoming economic data from both Japan and the US, and whether the improvement in global risk appetite persists. This post Japanese Yen Stages Resilient Recovery Against US Dollar as Global Market Sentiment Shifts first appeared on BitcoinWorld .
24 Mar 2026, 08:45
Hedera’s HBAR Price Jumps By 4% Ahead of BitTrade Exchange Debut

Hedera’s HBAR is up by 4% today, March 24, 2026. HBAR is to be listed on Japanese exchange BitTrade on March 25, 2026. Crypto influencer believes that HBAR is undervalued. Hedera’s native token, HBAR, climbed more than 4% today, March 24, 2026 as per CoinMarketCap. With this surge, the token is currently hovering around the $0.0926 mark and it is in line with Bitcoin’s gain. This uptick rides a wave of broader market optimism that has been triggered by the recent geopolitical de-escalation (Trump putting a pause on major strikes in Iran). Even though this is one of the reasons why the price of the token surged but the other catalyst that has also helped push the price of the token is the upcoming listing on Japan’s BitTrade exchange. At press time, the price of the token stands at $0.09290 with an uptick of 4.23% in the last 24-hours as per CoinMarketCap . HBAR 24-hours chart BitTrade Listing Ignites Demand The standout driver behind HBAR’s performance is the BitTrade announcement to support HBAR deposits, withdrawals. The trading, according to the announcement on X, will begin from tomorrow March 25, 2026. With this development, the Japanese users will also be able to invest in this token. 新規取扱い開始のお知らせ 暗号資産 #ヘデラ・ハッシュグラフ $HBAR の入出金、販売所での取扱いを3月25日(水)(予定)より開始いたします。 ■取扱い開始日時: 2026年3月25日 12:00(予定) ■詳細はこちら: https://t.co/OPmbcpGJGF #ビットトレード #新規上場 pic.twitter.com/F84yrH58bx — BitTrade(ビットトレード)公式 (@BitTrade_jp) March 24, 2026 As soon as the announcement was made public, the trading volume exploded. As it can be seen from the above screenshot, the trading volume has increased by 77.87% in the last 24-hours. This number indicates that the investors are strongly anticipating this token to be released within the Japanese market. Exchange listings usually spark short-term rallies as they boost liquidity and draw in fresh capital. For Hedera, which has focused on enterprise-grade blockchain solutions, this could mark a pivotal step into Asia’s compliant crypto ecosystem. Traders are positioning early, betting on heightened accessibility to fuel near-term demand. However, it has been observed that such surge usually cools off once the hype fades and hence there is a risk of sudden pullback as well. Bitcoin Beta and Regulatory Boost HBAR did not move alone. It has moved almost along with Bitcoin, as the token recovered after President Trump put a pause on planned attacks on Iran. This news provided relief in the Middle East and sparked a risk-on rally across the crypto market. This macro tailwind amplified HBAR’s gains, turning a modest rebound into great gains. Adding to fuel to this fire is Hedera’s favorable regulatory standing. In a recent joint statement, issued by the SEC and CFTC, classified HBAR as a “digital commodity” and not a security. This development provided a great amount of clarity and stripped off uncertainty that existed around the token. The clarity is in line with Hedera’s council driven governance model, which prioritizes compliance and real-world utility in areas like supply chain and payments. Bullish sentiment around this narrative persists, especially as the proposed CLARITY Act aims to enshrine such classifications into law, potentially unlocking institutional flows. Technical Outlook The token now tests support at the 7-day exponential moving average of $0.0919. Holding above this could propel a retest of resistance near the 30-day simple moving average at $0.0964, a breakout there might flip the script on the prevailing downtrend. On the flip side, a slip below $0.0919 risks cascading toward the recent Fibonacci swing low at $0.0881, where buyers could step in again. Volume remains the wildcard, the BitTrade hype has increased participation but sustaining it post-listing will dictate momentum. HBAR Seen as Undervalued Bet on Institutional Adoption Crypto influencer, CryptoSensei, posted on X and stated that there is a disconnect between HBAR’s current price and its underlying fundamentals. The influencer thinks that the network is undervalued even though there is a steady growth in enterprise adoption. This might be one of the most overlooked setups going into 2026. This video breaks down why $HBAR and @HEDERA could be massively undervalued despite what we’re seeing on price If adoption continues to compound and institutional flows start entering through things like ETFs or… pic.twitter.com/pWgUhmDQmd — CryptoSensei (@Crypt0Senseii) March 23, 2026 As everybody is focusing on institutional access through products such as ETFs and other compliant investment vehicles, some believe HBAR could see a significant rise if capital inflows accelerate. The broader narrative highlights Hedera’s real-world utility and scalability, with proponents arguing that continued adoption could eventually be reflected in its market valuation. Also Read: Hedera HBAR Price Battles $0.10 Resistance Amid Weak Futures Activity
24 Mar 2026, 08:42
SIREN Tanks 70% in a Single Day as ZachXBT and Bubblemaps Sound the Alarm

The AI-focused token operating on the BNB Chain continues with its immense volatility, but this time in the opposite direction. After charting massive double- and even triple-digit gains for days and weeks, the token has plummeted by over 70% since its March 22 all-time high amid ongoing scrutiny from the community. SIREN Dumps Hard CryptoPotato repeatedly reported SIREN’s massive price gains over the past several days. Recall that the token traded at $0.40 by March 10 before it went on an incredible run that culminated in the late hours of March 22 with an all-time high of $3.65. This sort of rally is highly unexpected and surprising at the moment, given the overall market conditions. The rest of the crypto market struggles to post 2-3-5% weekly gains, while one altcoin, which had a questionable first year of its existence, stole the show and dwarfed all others. However, this exponential rise reached its (somewhat expected) end in the past 24 hours. The asset has crashed by over 70% since the aforementioned ATH, and now struggles to remain above $1.00. This intense collapse has pushed it from being among the top 40 alts by market cap to outside of the top 80. It also came just as many users on X speculated that SIREN could be “the biggest scam of 2026.” The general consensus on X is that this pump was an apparent market manipulation by one entity. SIREN Price on CoinGecko The Warnings Bubblemaps warned yesterday that a single cluster owns almost 50% of SIREN’s supply. At the asset’s peak price, this was worth roughly $1.5 billion, and the analysts added that “this only ends one way” hours before the actual crash took place. They added that SIREN launched in February 2025 as the “first on-chain AI agent analyst on BNB.” However, it was “largely abandoned” shortly after launch. They also explained when this one cluster of over 200 wallets purchased the tokens (June and February 2025) and dispersed them to 47 addresses. Although the cluster’s identity remains officially unknown, it has been linked by ZachXBT and others to DWF Labs. I started graphing the 48.5% SIREN cluster today on BSC and noticed the addresses link to several obscure DWF affiliated tokens onchain (LADYS, RACA, TOMO, etc) — ZachXBT (@zachxbt) March 23, 2026 The post SIREN Tanks 70% in a Single Day as ZachXBT and Bubblemaps Sound the Alarm appeared first on CryptoPotato .
24 Mar 2026, 08:40
Bitcoin Bottom Prediction: CryptoQuant Analyst Reveals Crucial Two-Month Timeline Based on Halving History
BitcoinWorld Bitcoin Bottom Prediction: CryptoQuant Analyst Reveals Crucial Two-Month Timeline Based on Halving History Amsterdam-based cryptocurrency analytics firm CryptoQuant has released new analysis suggesting Bitcoin’s market bottom may be approximately two months away, according to senior analyst Maartunn’s recent social media observations about historical halving patterns. Bitcoin Bottom Analysis Based on Halving Cycles CryptoQuant analyst Maartunn recently noted on platform X that 703 days have passed since Bitcoin’s last halving event. Importantly, he highlighted historical patterns showing market bottoms typically begin forming around the 777-day mark following previous halvings. Consequently, this analysis suggests investors might see clearer market direction within the next two months. The cryptocurrency community generally respects CryptoQuant’s data-driven approach to market analysis. Bitcoin halvings represent programmed events reducing mining rewards by 50%. Historically, these events have significantly influenced Bitcoin’s price cycles. The current cycle follows the May 2020 halving, which reduced block rewards from 12.5 to 6.25 BTC. Market analysts consistently study these four-year cycles for predictive insights. Historical Context of Bitcoin Market Cycles Previous Bitcoin halvings occurred in 2012, 2016, and 2020. Each event preceded substantial price increases, though timing varied. For instance, the 2016 halving saw Bitcoin bottom approximately 518 days later. Meanwhile, the 2012 cycle showed different characteristics entirely. However, the 777-day pattern specifically references recent cycles that analysts find particularly relevant. Market data reveals several key patterns: Post-halving accumulation phases typically last 12-18 months Institutional adoption has altered recent cycle dynamics Macroeconomic factors increasingly influence cryptocurrency markets Regulatory developments create additional market variables Expert Analysis Methodology CryptoQuant’s analysis employs on-chain metrics rather than price charts alone. The firm examines exchange flows, miner behavior, and wallet movements. Additionally, they track institutional accumulation patterns through transparent blockchain data. This methodology provides objective insights beyond traditional technical analysis. Several indicators currently suggest accumulation: Exchange reserves continue declining steadily Long-term holder metrics show increased conviction Miner selling pressure has diminished significantly Institutional wallets demonstrate consistent accumulation Current Market Conditions and Indicators The cryptocurrency market currently faces multiple pressures. Global economic uncertainty affects all risk assets. Furthermore, regulatory clarity remains incomplete in major markets. However, Bitcoin’s network fundamentals continue strengthening despite price volatility. Network security has reached all-time highs. Daily transactions maintain consistent volume. Development activity continues accelerating across Bitcoin’s ecosystem. These fundamental strengths provide context for cycle analysis. Bitcoin Halving Cycle Comparison Halving Year Days to Bottom Bottom Price Subsequent Peak 2012 ~400 days $12 $1,150 2016 ~518 days $500 $19,700 2020 ~777 days* $3,850 $69,000 *Projected based on current analysis Broader Market Implications Bitcoin’s market cycles historically influence altcoin markets. Typically, Bitcoin dominance peaks during accumulation phases. Subsequently, capital rotates toward altcoins during expansion periods. This pattern has repeated across multiple market cycles. The current analysis suggests several potential outcomes. First, Bitcoin might establish a definitive price floor. Second, market sentiment could shift from fear to accumulation. Third, institutional interest may increase at perceived bottom levels. Finally, development activity often accelerates during these periods. Analytical Limitations and Considerations While historical patterns provide guidance, they don’t guarantee future results. Market conditions evolve with each cycle. Specifically, institutional participation has transformed market dynamics. Additionally, global macroeconomic factors now exert greater influence. Analysts emphasize several important caveats: Past performance never guarantees future results Black swan events can disrupt historical patterns Regulatory changes may alter market structure Technological developments create new variables Investors should consider multiple data sources. Diversified analysis provides better risk management. Furthermore, personal financial situations vary significantly. Professional advice remains essential for investment decisions. Conclusion CryptoQuant’s analysis suggests Bitcoin’s market bottom may approach within two months based on historical halving cycles. The 777-day pattern provides a framework for understanding current market positioning. However, investors must consider numerous variables beyond historical patterns. Market fundamentals, regulatory developments, and macroeconomic conditions all influence cryptocurrency prices. Ultimately, the Bitcoin bottom prediction represents one analytical perspective among many in the rapidly evolving digital asset landscape. FAQs Q1: What is a Bitcoin halving? A Bitcoin halving reduces mining rewards by 50%. This programmed event occurs approximately every four years. It controls Bitcoin’s inflation rate and supply issuance. Q2: How reliable are historical patterns for predicting Bitcoin bottoms? Historical patterns provide context but not guarantees. Market conditions evolve with each cycle. Analysts use multiple data points for comprehensive analysis. Q3: What metrics does CryptoQuant use for analysis? CryptoQuant analyzes on-chain data including exchange flows, miner activity, and wallet movements. They combine these metrics with market cycle analysis. Q4: How does institutional investment affect Bitcoin cycles? Institutional participation has lengthened market cycles. It has also increased correlation with traditional markets. This represents a significant evolution from earlier cycles. Q5: What other factors should investors consider beyond cycle analysis? Investors should monitor regulatory developments, technological advancements, macroeconomic conditions, and network fundamentals. Diversified analysis provides better perspective. This post Bitcoin Bottom Prediction: CryptoQuant Analyst Reveals Crucial Two-Month Timeline Based on Halving History first appeared on BitcoinWorld .
24 Mar 2026, 08:37
Ripple (XRP) Price Predictions for This Week
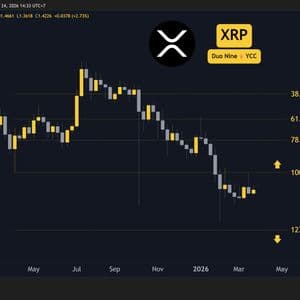
XRP is holding steady at $1.4. Where will it go next? Ripple (XRP) Price Predictions: Analysis Key support levels: $1.4 Key resistance levels: $1.6 XRP Consolidates Around $1.4 After sellers halted the bullish momentum at the $1.6 resistance, XRP entered a pullback and held well above the key $1.4 support. So far, market participants have found equilibrium at this level, but it is unlikely to last. Based on the price action, another test of the key resistance appears likely, especially if the support continues to hold in the coming days and weeks. On the other hand, a loss of $1.4 would encourage sellers to push lower. Source: TradingView Reversal Postponed With the resistance at $1.6 still intact, a clear reversal will require more time to materialize and will be confirmed as soon as this level breaks and turns into support. Until then, the price may continue to move sideways. Volume is also flat, which is indicative of a low volatility period. Nevertheless, when buyers return to re-test the resistance, the volume could spike and send bulls into a new rally. Source: TradingView RSI Bullish Cross Imminent? On the weekly chart, the RSI appears inches away from a bullish cross. This is an important signal that the market wants to turn bullish. Now the question is if bears will allow it, since so far, they have managed to contain any rally. Either way, by the end of March, the price could make up its mind by attempting to break away from its current range between $1.4 and $1.6, with pressure building up right now. Source: TradingView The post Ripple (XRP) Price Predictions for This Week appeared first on CryptoPotato .


