


News
23 Mar 2026, 11:15
Bybit Spring Blossom: Rewards in Full Bloom with 15,500 USDT in Prizes this Spring

Dubai, United Arab Emirates, March 23rd, 2026, Chainwire Bybit , the world’s second-largest cryptocurrency exchange by trading volume, invites traders to be part of its limited-time Spring Blossom event, featuring a 15,500 USDT prize pool. Participants accumulate lucky draw entries through all eligible activities after signing up for the event. After signing up for the event, participants accumulate lucky draw entries through all eligible activities. From now until April 20, 2026, Bybit’s exclusive Spring Blossom lucky draw chances are reserved for eligible users who may complete three simple tasks: Fiat Deposit: Participants can deposit funds through supported fiat payment methods to earn up to 7 lucky draw chances. Eligible deposit methods include P2P Trading , Fiat Deposit , and One-Click Buy on Bybit. Trading Rewards: Eligible trading activities may entitle participants to up to 4 additional lucky draw chances, with rewards tied to trading volume milestones achieved throughout the event period. Season of Sharing: Users introducing their friends to the Bybit experience will receive 1 additional lucky draw chance per successful referral during the active event window. Bybit is committed to supporting and fostering the growth of its community. At the opportune time of spring, the platform rewards deposits, trading participation, and referrals in this season of renewal. Terms and conditions apply. For details of eligibility and participation rules, users may visit: Bybit Fiat Spring Blossom: Deposit, trade & share a 15,500 USDT prize pool #Bybit / #TheCryptoArk / #IMakeIt About Bybit Bybit is the world’s second-largest cryptocurrency exchange by trading volume, serving a global community of over 80 million users. Founded in 2018, Bybit is redefining openness in the decentralized world by creating a simpler, open, and equal ecosystem for everyone. With a strong focus on Web3, Bybit partners strategically with leading blockchain protocols to provide robust infrastructure and drive on-chain innovation. Renowned for its secure custody, diverse marketplaces, intuitive user experience, and advanced blockchain tools, Bybit bridges the gap between TradFi and DeFi, empowering builders, creators, and enthusiasts to unlock the full potential of Web3. Discover the future of decentralized finance at Bybit.com . For more details about Bybit, please visit Bybit Press For media inquiries, please contact: [email protected] For updates, please follow: Bybit's Communities and Social Media Discord | Facebook | Instagram | LinkedIn | Reddit | Telegram | TikTok | X | Youtube ContactHead of PRTony AuBybittony.au@bybit Disclaimer: This is a sponsored press release and is for informational purposes only. It does not reflect the views of Crypto Daily, nor is it intended to be used as legal, tax, investment, or financial advice.
23 Mar 2026, 11:15
Bitcoin Price Analysis: 5 Critical Factors Driving Market Volatility This Week

BitcoinWorld Bitcoin Price Analysis: 5 Critical Factors Driving Market Volatility This Week Global cryptocurrency markets face a pivotal week as Bitcoin confronts a confluence of technical and macroeconomic pressures. Analysts identify five critical factors that could determine the digital asset’s trajectory in the coming days, ranging from chart patterns echoing past corrections to significant shifts in long-term holder behavior. This analysis provides a comprehensive, evidence-based examination of the current landscape for the world’s leading cryptocurrency. Bitcoin Price Analysis: Navigating Key Technical Levels Market technicians currently monitor two primary price scenarios for Bitcoin. The first involves a potential retest of the $65,000 support level, a zone that previously acted as resistance. Conversely, a more bearish outlook suggests a deeper correction toward the $50,000 range. This possibility emerges from the breakdown of a critical support trendline established during the second quarter. Historical data from blockchain analytics firm Glassnode indicates that similar breakdowns in previous market cycles have preceded corrections of 20-30%. The $65,000 level represents a psychological and technical battleground where significant trading volume has historically concentrated. Examining the Recurring Bear Flag Pattern A concerning technical formation gaining attention is the potential development of a bear flag pattern. This pattern mirrors a structure observed in January 2025, which preceded a notable decline. A bear flag typically forms after a sharp downward move, followed by a period of consolidation with a slight upward slope. The pattern completes with a breakdown below the consolidation support, often leading to a move equal to the initial decline’s magnitude. Chart analysts note that the current price action shows similarities in both structure and trading volume profile. However, they caution that pattern recognition requires confirmation through a decisive break below key support, which has not yet occurred. Historical Context and Market Psychology The recurrence of similar chart patterns highlights persistent market psychology. During periods of uncertainty, traders often react to familiar technical signals, creating self-fulfilling prophecies. The January pattern saw a 22% decline over three weeks following its confirmation. Market participants now watch for volume spikes and order book liquidity shifts around the $62,000 to $64,000 range, which could signal the pattern’s validation or invalidation. Macroeconomic Uncertainty and Geopolitical Tensions Beyond technical charts, traditional financial markets exert substantial pressure on cryptocurrency valuations. Escalating tensions in the Middle East have triggered a flight to safety among institutional investors. This geopolitical instability has produced divergent reactions in classic safe-haven assets. Gold has entered a bearish phase, surprising some analysts, while Brent crude oil prices have surged past the $100 per barrel mark. This commodity price shock introduces stagflation concerns, complicating central bank policy decisions globally. Historically, Bitcoin has demonstrated varied correlations to these assets during periods of geopolitical stress, sometimes acting as a risk asset and other times as a digital hedge. The following table summarizes recent movements in key correlated assets: Asset Weekly Change Primary Driver Brent Crude Oil +12.5% Geopolitical Supply Concerns Gold (Spot) -3.2% Stronger US Dollar, Rising Yields US Dollar Index (DXY) +2.1% Flight to Safety & Rate Expectations S&P 500 -4.8% Risk-Off Sentiment Federal Reserve Policy and Risk Asset Pressure Simultaneously, monetary policy expectations create headwinds for speculative assets. Recent inflation data and hawkish commentary from Federal Reserve officials have caused markets to price in a higher probability of an interest rate hike. According to CME Group’s FedWatch Tool, the implied probability of a 25-basis-point increase at the next Federal Open Market Committee meeting has risen to 38%, up from just 15% two weeks prior. Higher interest rates typically strengthen the US dollar and increase the opportunity cost of holding non-yielding assets like Bitcoin. Consequently, the entire spectrum of risk assets, including technology stocks and growth-oriented cryptocurrencies, faces continued valuation pressure as capital seeks safer, yield-bearing alternatives. The Liquidity Drain and Its Impact Quantitative tightening by major central banks compounds the issue. As balance sheets contract, global liquidity diminishes, leaving less capital available for speculative investments. This environment challenges the “digital gold” narrative for Bitcoin, as investors prioritize immediate cash flow and capital preservation over long-term technological bets. Market analysts reference the 2018 crypto bear market, which coincided with a period of Federal Reserve balance sheet reduction and rising rates. On-Chain Metrics Signal Holder Capitulation Perhaps the most telling data comes from the blockchain itself. The Spent Output Profit Ratio (SOPR), a key on-chain metric, has dropped to 0.64. This figure indicates that coins moved on-chain are being sold at an average loss of 36%. The SOPR metric calculates the profit or loss of coins based on their purchase price (realized value) versus their sale price. A value below 1.0 signals net realized losses across the network. Notably, data suggests this selling pressure originates from long-term holders (LTHs), entities holding coins for more than 155 days. Historically, sustained periods of LTH capitulation, where SOPR remains below 0.75, have marked local price bottoms or significant accumulation zones. Key on-chain signals to monitor this week include: SOPR Trend: Whether the metric stabilizes or continues to decline. Exchange Net Flow: A shift from inflows to outflows would suggest selling pressure is abating. MVRV Ratio: The Market Value to Realized Value ratio indicates if the asset is trading below its “fair value” based on the average cost basis of all coins. Holder Composition: A decrease in the number of long-term holders coupled with an increase in short-term holders can signal a market bottom formation. Conclusion This week’s Bitcoin price analysis reveals a market at a critical juncture, influenced by a complex interplay of technical patterns, macroeconomic forces, and fundamental on-chain behavior. The convergence of a potential bear flag, hawkish central bank expectations, geopolitical commodity shocks, and signals of long-term holder stress creates a high-volatility environment. While historical patterns and current data point to continued near-term pressure, they also highlight potential zones of support and accumulation. Market participants should prioritize risk management and monitor the confirmation or rejection of the identified technical levels, alongside key inflation data and Federal Reserve communications, to navigate the evolving landscape for the world’s premier cryptocurrency. FAQs Q1: What is a bear flag pattern in technical analysis? A bear flag is a continuation pattern observed on price charts. It forms after a strong downward move (the flagpole), followed by a period of consolidation that slopes slightly upward (the flag). The pattern is considered complete and bearish when the price breaks below the lower boundary of the consolidation channel, often leading to a downward move similar in magnitude to the initial flagpole. Q2: How does the Spent Output Profit Ratio (SOPR) work? The SOPR is an on-chain metric that measures whether coins being spent (moved) on the Bitcoin network are being sold at a profit or loss. It is calculated by dividing the realized value (sale price) by the original value (purchase price) of all coins spent in a given period. A SOPR above 1 indicates net profit-taking, while a value below 1, such as 0.64, indicates net realized losses across the market. Q3: Why do rising oil prices and interest rates affect Bitcoin? Rising oil prices can fuel inflation, prompting central banks like the Federal Reserve to raise interest rates to combat it. Higher interest rates make holding non-yielding assets like Bitcoin less attractive compared to interest-bearing securities. They also typically strengthen the US dollar, in which Bitcoin is primarily quoted, applying downward pressure on its price. Furthermore, they can trigger a broader “risk-off” sentiment, negatively impacting all speculative assets. Q4: What does “long-term holder capitulation” mean? Long-term holder (LTH) capitulation refers to a market phase where investors who have held Bitcoin for an extended period (typically >155 days) begin selling their coins, often at a loss. This behavior is usually driven by exhaustion, fear, or a loss of conviction after a prolonged price decline. On-chain, it’s signaled by a falling SOPR and a decrease in the total supply held by LTH addresses. Historically, such events have often preceded major market bottoms. Q5: Can Bitcoin act as a hedge during geopolitical tensions? Bitcoin’s role as a hedge is complex and has evolved. During some past geopolitical events, it has shown positive price action, decoupling from traditional markets (acting as a “safe haven”). In other instances, like the current environment, it has traded more in line with risk assets like technology stocks (acting as a “risk-on” asset). Its performance depends on the nature of the crisis, market liquidity, and the concurrent behavior of traditional hedges like gold and the US dollar. This post Bitcoin Price Analysis: 5 Critical Factors Driving Market Volatility This Week first appeared on BitcoinWorld .
23 Mar 2026, 11:14
Bybit Spring Blossom: Rewards in Full Bloom with 15,500 USDT in Prizes this Spring
BitcoinWorld Bybit Spring Blossom: Rewards in Full Bloom with 15,500 USDT in Prizes this Spring Dubai, United Arab Emirates, March 23rd, 2026, Chainwire Bybit , the world’s second-largest cryptocurrency exchange by trading volume, invites traders to be part of its limited-time Spring Blossom event, featuring a 15,500 USDT prize pool . Participants accumulate lucky draw entries through all eligible activities after signing up for the event. After signing up for the event, participants accumulate lucky draw entries through all eligible activities. From now until April 20, 2026 , Bybit’s exclusive Spring Blossom lucky draw chances are reserved for eligible users who may complete three simple tasks: Fiat Deposit: Participants can deposit funds through supported fiat payment methods to earn up to 7 lucky draw chances . Eligible deposit methods include P2P Trading , Fiat Deposit , and One-Click Buy on Bybit. Trading Rewards: Eligible trading activities may entitle participants to up to 4 additional lucky draw chances , with rewards tied to trading volume milestones achieved throughout the event period. Season of Sharing: Users introducing their friends to the Bybit experience will receive 1 additional lucky draw chance per successful referral during the active event window. Bybit is committed to supporting and fostering the growth of its community. At the opportune time of spring, the platform rewards deposits, trading participation, and referrals in this season of renewal. Terms and conditions apply. For details of eligibility and participation rules, users may visit: Bybit Fiat Spring Blossom: Deposit, trade & share a 15,500 USDT prize pool #Bybit / #TheCryptoArk / #IMakeIt About Bybit Bybit is the world’s second-largest cryptocurrency exchange by trading volume, serving a global community of over 80 million users. Founded in 2018, Bybit is redefining openness in the decentralized world by creating a simpler, open, and equal ecosystem for everyone. With a strong focus on Web3, Bybit partners strategically with leading blockchain protocols to provide robust infrastructure and drive on-chain innovation. Renowned for its secure custody, diverse marketplaces, intuitive user experience, and advanced blockchain tools, Bybit bridges the gap between TradFi and DeFi, empowering builders, creators, and enthusiasts to unlock the full potential of Web3. Discover the future of decentralized finance at Bybit.com . For more details about Bybit, please visit Bybit Press For media inquiries, please contact: [email protected] For updates, please follow: Bybit’s Communities and Social Media Discord | Facebook | Instagram | LinkedIn | Reddit | Telegram | TikTok | X | Youtube Contact Head of PR Tony Au Bybit tony.au@bybit This post Bybit Spring Blossom: Rewards in Full Bloom with 15,500 USDT in Prizes this Spring first appeared on BitcoinWorld .
23 Mar 2026, 11:10
JASMY Comprehensive Technical Analysis: Detailed Review of March 23, 2026

JASMY stuck in bearish trend at $0.01; Supertrend resistance and BTC pressure risky. $0.0052 support critical, downside may continue without volume increase.
23 Mar 2026, 11:09
CAKE price analysis following a $679K PancakeSwap exploit
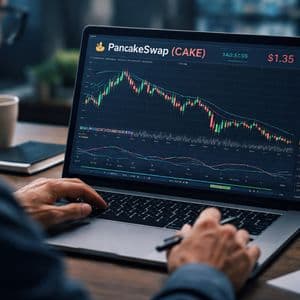
A $679K exploit involving a liquidity pool on PancakeSwap has raised fresh questions about risk in decentralised finance (DeFi). While the incident did not directly compromise PancakeSwap itself, it still arrived at a sensitive time for the CAKE token. CAKE’s price action has remained weak, with the token currently trading near $1.35 after a modest daily decline. This drop, however, appears to be driven more by broader market conditions than by the exploit alone. The crypto market has been under pressure due to macroeconomic uncertainty and a general shift away from risk assets amid the ongoing war in Iran , and CAKE has been moving closely in line with Bitcoin rather than reacting independently. Market reaction after the exploit remains muted Despite the headlines surrounding the exploit, CAKE has not experienced a sharp or panic-driven selloff mainly because the exploit has been linked to a flaw in the burn mechanism of the BCE token used in the affected pool rather than the PancakeSwap protocol. According to sources, the attacker manipulated this burn mechanism to distort liquidity pool balances and extract value. https://twitter.com/Phalcon_xyz/status/2035998829296984572?s=20 Such an attack highlights a growing concern in DeFi, where token design can introduce vulnerabilities even when the platform itself is secure. For CAKE holders, this distinction is important because it limits the direct impact on the token’s long-term fundamentals. Even so, the presence of such risks can still weigh on sentiment across the ecosystem. PancakeSwap technical analysis At the moment, price remains below its short-term moving average, which signals a bearish bias in the near term. Volume has also increased during the recent decline, indicating that sellers are still active in the market. From a technical perspective, CAKE is currently trading within a narrow range that reflects market indecision. The $1.30 level has emerged as an immediate support, while the immediate resistance sits near $1.42 based on recent price behaviour. PancakeSwap price analysis | Source: TradingView On the upside, a break above $1.42 could open the path to $1.52, a key breakout level for traders to watch. Further resistance levels are seen near $1.68 and $1.84 if momentum builds. Macro pressure outweighs PancakeSwap-specific factors The broader crypto environment is currently playing a dominant role in CAKE’s price movement. Recent signals from central banks and ongoing geopolitical tensions in the Middle East have pushed investors toward safer assets. This has resulted in a general pullback across altcoins, including CAKE. Bitcoin’s performance continues to act as the main driver, with altcoins following its direction closely. As long as this correlation remains strong, CAKE is unlikely to show independent strength. A recovery in the wider market would likely provide the support needed for a rebound. The post CAKE price analysis following a $679K PancakeSwap exploit appeared first on Invezz
23 Mar 2026, 11:05
XRP Price Prediction: Analyst Eyes $10+ as Key Support Levels Come Into Focus

XRP continues to trade within a volatile consolidation range, keeping investors uncertain as price action struggles to establish a clear direction. After facing rejection near its early 2026 highs, the asset now moves within a tightening structure that reflects surface uncertainty but signals preparation beneath. This phase often precedes decisive market moves, especially for assets with strong historical cycles, such as XRP. Crypto analyst ChartNerd has brought renewed focus to a January 2026 outlook formed when XRP peaked near $2.12. He maintains that a potential retracement toward the $0.70–$0.80 range would align with a broader bullish structure rather than invalidate it. According to his analysis, such a move would mark a retest of the Gaussian Channel support on higher timeframes, a technical zone that often acts as a springboard for major rallies. IF $XRP does come back towards $0.80/$0.70, remember who was calling the potential back in January at $2.12 – as illustrated, the Guassian Channel retest would likely mark a springboard for the rally to $10+ https://t.co/1V5rNGY4nO pic.twitter.com/PjqrJv2AVz — ChartNerd (@ChartNerdTA) March 22, 2026 The Strength of XRP’s Macro Structure XRP’s long-term logarithmic chart continues to show a consistent pattern of higher lows dating back to 2014. This structure confirms that the asset remains in a macro uptrend despite periods of sharp volatility. Each correction has historically reinforced the foundation for the next expansion phase, which suggests that any short-term weakness still fits within a broader accumulation cycle. The current price, around $1.37, places XRP between key resistance and projected support zones. The $2.00 to $2.20 range remains a major barrier, as previous attempts to break above this region have encountered strong rejection. Price must clear this level decisively to unlock sustained upward momentum towards $10. Why a Pullback Could Be Bullish Market mechanics support the possibility of a temporary downward move before a breakout . Late-stage consolidations often include liquidity sweeps that remove weak positions and redistribute supply to stronger hands. A controlled retracement toward deeper support could strengthen market structure and improve the probability of a sustained rally. We are on X, follow us to connect with us :- @TimesTabloid1 — TimesTabloid (@TimesTabloid1) June 15, 2025 This process does not signal weakness; it reflects market efficiency. Strong trends often require resets to maintain long-term momentum, especially in assets with high retail participation like XRP. Outlook: Volatility Before Expansion ChartNerd’s broader projections remain intact despite short-term uncertainty. His framework suggests that XRP could target significantly higher levels once it completes this structural phase. However, the path toward that outcome may include sharp movements in both directions. XRP now sits at a decisive point where short-term volatility could define long-term opportunity. Traders who understand this distinction will be better positioned for what could become the asset’s next major expansion cycle. Disclaimer : This content is meant to inform and should not be considered financial advice. The views expressed in this article may include the author’s personal opinions and do not represent Times Tabloid’s opinion. Readers are urged to do in-depth research before making any investment decisions. Any action taken by the reader is strictly at their own risk. Times Tabloid is not responsible for any financial losses. Follow us on Twitter , Facebook , Telegram , and Google News The post XRP Price Prediction: Analyst Eyes $10+ as Key Support Levels Come Into Focus appeared first on Times Tabloid .
