


News
4 Jun 2026, 10:36
Bitcoin sees a 28 percent “quantum discount”! What does this mean for price targets?

🚨 Bitcoin faces a record 28 percent “quantum discount” amid tech worries. 🤖 The market is watching closely as $BTC lags behind analyst model prices. 📉 Quantum threats and stalled upgrades are shaking investor confidence. Continue Reading: Bitcoin sees a 28 percent “quantum discount”! What does this mean for price targets? The post Bitcoin sees a 28 percent “quantum discount”! What does this mean for price targets? appeared first on COINTURK NEWS .
4 Jun 2026, 10:31
Ethereum Price Prediction: $1,750 Lifeline Faces $1,600 Breakdown Risk

Ethereum is testing a critical support zone near $1,750 after sweeping its February lows and returning to the bottom of its multi-month range. Analysts say ETH must hold the $1,700-$1,800 area to avoid a deeper move toward the weekly order block near $1,600. Ethereum Price Tests Critical Support After Sweeping February Lows Crypto analyst Daan Crypto Trades highlighted a key support test for Ethereum (ETH) after the asset returned to the bottom of its multi-month trading range and briefly moved below its February lows. Ethereum Daily Chart (ETH/USDT). Source: Daan Crypto Trades on X / TradingView The chart shows ETH falling to the $1,730-$1,750 area, a zone that previously acted as support during the February sell-off. The latest decline pushed price below those earlier lows before buyers stepped in, creating what traders often describe as a liquidity sweep. A liquidity sweep occurs when price briefly breaks below a well-known support level, triggering stop-loss orders and liquidating leveraged positions before attempting to recover. The chart highlights a similar event in February, where ETH dipped below support and later rebounded. According to Daan Crypto Trades, the current range low represents a critical level for bullish market participants. Holding this area could allow Ethereum to remain within its broader trading range that has been in place since February. The chart also shows a major resistance zone between roughly $2,340 and $2,380. ETH previously failed to break above that region several times during April and May before the latest decline accelerated. Trading volume increased during the recent sell-off, suggesting heightened market activity as Ethereum tested support. If buyers continue defending the range low, traders may watch for signs of stabilization. However, a sustained break below the February lows could open the door for a deeper correction and a potential shift in market structure. Ethereum Price Holds $1,750 Support as Analyst Warns of Possible Drop to $1,600 Crypto analyst Team LAMBO said Ethereum (ETH) has reached its initial bearish target near $1,750 but remains at a critical support zone that could determine its next major move. Ethereum Weekly Chart (ETH/USDT). Source: Team LAMBO on X / TradingView The chart shows ETH breaking below its 2026 lows before finding support near $1,750. According to the analyst, that downside target has now been fulfilled, but the recent bounce has not been strong enough to confirm a trend reversal. Team LAMBO highlighted several technical factors supporting the $1,700-$1,800 area. The zone contains the 0.882 Fibonacci retracement level near $1,803 and a weekly fair value gap (FVG) around $1,700. These overlapping support levels create a confluence area that could attract buyers. Despite the support cluster, the analyst noted that Ethereum remains vulnerable while trading below key resistance. The chart identifies a weekly order block (OB) near $1,600 as the next major downside area if current support fails to hold. The broader structure shows ETH trading within a long-term descending channel that has guided price action since late 2025. Recent attempts to recover toward the upper boundary of the channel were rejected, leading to the latest decline. Team LAMBO said he remains neutral in the short term and is watching two key levels for confirmation. A weekly move above $1,900 could improve the bullish outlook, while a breakdown below $1,700 would strengthen the bearish case and increase the likelihood of a move toward the $1,600 weekly order block.
4 Jun 2026, 10:20
This bitcoin metric has marked every bear market bottom, and it's just flashed again
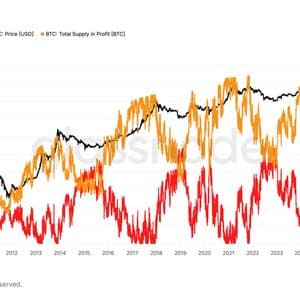
More than half of the bitcoin in circulation is sitting on unrealized losses as the BTC price tests historically significant bear-market support levels.
4 Jun 2026, 10:20
CandyChain – The AI Blockchain That Pays You Back

BitcoinWorld CandyChain – The AI Blockchain That Pays You Back Most blockchains take from you quietly. Gas fees here, settlement charges there, a percentage skimmed off every interaction. CandyChain was built with the opposite philosophy – and it shows. So, What Even Is CandyChain? Let’s skip the corporate answer and be straight about it. CandyChain is an AI-integrated Layer 1 blockchain, meaning it’s not sitting on top of Ethereum, borrowing someone else’s infrastructure. It’s its own chain, with its own validator network, its own native coin, and its own rules. The AI layer isn’t a marketing buzzword tacked on afterwards, but baked into the way the chain processes activity, handles smart contracts, and powers the products built on top of it. Think of it less like a generic crypto platform and more like a purpose-built city. The roads, the power grid, the rules of the road, all designed from scratch, specifically for what’s being built on top of them – which is genuinely interesting. Five Products. One Ecosystem. Zero Filler. CandyChain doesn’t have a whitepaper full of “future roadmap” products that may or may not materialise. Its five core products will be live soon and will connect through the CANDY coin. CandyBet is a decentralised prediction market where users bet on real-world outcomes, sports, elections, crypto prices, and economic events. It charges 2% per bet and returns 1% as CANDY cashback on every single wager. Win or lose. It’s the first prediction market in the world that gives you a guaranteed return just for participating. CandyRush is a social earning platform. A place where users can play games and get rewarded. Ehere play time converts to RUSH tokens, minted directly to your CandyChain wallet in real time. It is here that you can convert it into CANDY and use it in the ecosystem. CandySwap is the native DEX. Swap tokens, provide liquidity, trade RUSH, trade CANDY, all on-chain, all non-custodial. The exchange your ecosystem actually needs, rather than forcing users off-platform to Uniswap or PancakeSwap every time they want to move value around. CandyVault: CandyVault is a connector between traditional assets and blockchain technology through the CRC-20 token standard. This is a proprietary enhancement built specifically for real-world asset tokenisation on CandyChain. Beyond standard token functionality, CRC-20 introduces features such as asset backing verification, redemption mechanisms, merchant controls, expiry management, and seamless settlement using CANDY Coin. This creates a framework tailored for tokenised real-world assets. AI Agent Platform: This is one of the most anticipated products in the Candy Ecosystem. The AI Agent Platform enables autonomous AI agents to operate directly on-chain. Each agent is assigned its own blockchain wallet, maintains its own CANDY balance, and builds a publicly verifiable performance record that anyone can track through the CandyChain explorer. From trading and staking to prediction markets, these agents are designed to operate continuously, executing strategies transparently and without manual intervention. Five products. Each one useful independently. Each one is more valuable because the others exist. Why CANDY Is a Coin and Not a Token, and Why That Matters More Than You Think This distinction gets glossed over constantly, and it really shouldn’t. A token lives on someone else’s blockchain, borrows their infrastructure, pays gas fees, and is fundamentally dependent on a chain it cannot control. If this chain congests, your token transactions slow down and get expensive. If the chain changes its fee structure, your economics change whether you like it or not. A coin, on the other hand, is the native currency of its own chain. CANDY coin is what CandyChain runs on. Validators are compensated in CANDY. Gas fees are paid in CANDY. Every smart contract interaction across every product in the ecosystem consumes CANDY. The coin isn’t just one product in the ecosystem; it’s the fuel that powers the entire engine. This means CANDY demand is structural, not speculative. Every bet on CandyBet, every RUSH conversion on CandyRush, every swap on CandySwap, all of it creates real, ongoing demand for CANDY coin. Not because someone decided to create artificial scarcity, but because the chain literally cannot operate without it. That’s a fundamentally different value proposition from a token that sits in your wallet hoping someone buys it off you later. The Presale Is Open, and This Is the Part You Should Actually Read Before CANDY coin hits open markets, the presale is live at cryptocandy.io/presale . Presale participants get in before price discovery happens on the open market, with vesting terms structured to protect early buyers. The window where this is still a presale opportunity closes once the TGE happens. After that, you’re buying on the open market at whatever price the market decides. The infrastructure is real, the products are live, and the coin has structural demand baked into every on-chain interaction. The presale is the last moment it’s priced like a secret. Join the presale → cryptocandy.io/presale This post CandyChain – The AI Blockchain That Pays You Back first appeared on BitcoinWorld .
4 Jun 2026, 10:14
Peter Schiff says Bitcoin price has found support at $61,000

Peter Schiff, chief economist and global strategist at Europac, has stated that Bitcoin ( BTC ) price may have found support at $61,000. As Bitcoin price extended May’s losses in the first four days of this month, Schiff argued that the flagship coin may have found short-term support around its February low as of June 4. “Bitcoin found some short-term support around $61,000. That’s slightly above the February low of just under $60,000. It makes sense that there would be some initial support there. So far, it’s bounced over $2,000 off that low. Let’s see how long it lasts,” Schiff noted in an X post. Notably, the Bitcoin skeptic had previously cautioned traders of a potential crypto panic selling catalyzed by a possible stock market correction. However, Schiff highlighted that BTC price could mirror its post-February rally, which peaked in early May at about $82,000. Bitcoin price outlook amid whale sell-off Bitcoin price has experienced heightened selling pressure amid significant liquidations in the U.S. spot exchange-traded funds ( ETFs ), as Finbold reported . Notably, the ongoing stock market rally fueled by Artificial Intelligence (AI) has undermined overall BTC demand from institutional investors, despite supportive fundamentals. From a technical analysis standpoint, BTC’s price could be following a similar pattern to its post-2021 bull rally. Precisely, BTC price could be forming a falling wedge over the past two years, similar to the descending triangle after the 2021 bull rally. Historically, a falling wedge is a bullish reversal pattern, especially if the upper boundary is breached. BTC/USD 1-week chart. Source: TradingView Following the recent BTC price drop, trading at approximately $62,797 at the time of publication, it could be at the apex of a falling wedge consolidation, which aligns with Schiff’s support thesis. However, if the lower boundary of the falling wedge is breached, BTC price may experience further sell-off, potentially below $60,000, as Finbold explained . The post Peter Schiff says Bitcoin price has found support at $61,000 appeared first on Finbold .
4 Jun 2026, 10:14
SATA: 13% Yield Preferred Stock Paying Daily Dividends

Summary SATA offers a 13% annual dividend and trades below par, presenting an attractive yield opportunity. SATA benefits from strong asset coverage—about 1.9x—backed primarily by Strive’s significant Bitcoin holdings and cash reserves, with no debt senior to SATA. The daily dividend payment structure enhances cash flow and security for investors, while cumulative and penalty-compounding features provide robust dividend protections. I rate SATA a Buy below $100, given its yield, asset backing, daily dividends, and mechanisms supporting a return to par, though Bitcoin volatility remains a key risk. Strive’s Variable Rate Series A Perpetual Preferred Stock ( SATA ) has a $100 stated amount, a $100 liquidation preference, cumulative dividends, and a dividend rate Strive can adjust within the security’s limits to target a $100 share price. At a recent price around $97 and a 13% annual dividend on the $100 stated amount, the current yield is about 13.4%. I believe SATA earns a Buy rating due to SATA’s very strong dividend suspension protections and asset coverage. SATA is a preferred stock and capital structure that takes Bitcoin-driven credit risk. SATA investors also do not have a lien on Strive’s Bitcoin, but the asset coverage is ample support. Balance Sheet SATA is the preferred equity financing tool for a Bitcoin treasury and asset management company. Strive raises capital through its common stock and preferred stock ATM offers and uses the proceeds to purchase Bitcoin. The goal is to grow Bitcoin per share over time via these capital markets activities. So the key variables here are asset coverage, cash reserves, preferred issuance, Bitcoin exposure, and dividend policy. The company has no meaningful earnings to speak of and this should not be expected to change. In fact, this is by design so that the dividends on SATA can gain return of capital tax treatment. Strive’s operating business does not currently cover the preferred dividend. The company reported $2.8 million of Q1 2026 revenue, a $265.9 million GAAP net loss, and a $295.8 million unrealized loss on digital assets. Bitcoin accounting drove the loss, but SATA’s dividend support still comes from the balance sheet and not recurring earnings. As of June 1, 2026, Strive owns 19,000 BTC (worth $1.27 billion at today’s $67,000 per BTC price), $137.3 million of cash and equivalents, $49.5 million of STRC preferred stock, and 7.5 million SATA shares outstanding. At a 13% annual rate, the dividend burden is about $97.7 million per year. So by their cash alone they can pay over a year of dividends. And when counting the bitcoin, they can pay over 100 years of dividends even if BTC stays flat. Strive's Numbers (Strive) Add all three holdings—cash, STRC, BTC—and the visible asset pool is about $1.46 billion against roughly $751 million of SATA stated amount. That is about 1.9x asset coverage on perpetual preferred equity that never comes due. There is no debt on Strive’s balance sheet, so SATA is the most senior instrument. SATA is basically like high-yield credit with crypto collateral risk, but no obligation to repay principal unless in liquidation. Price Peg Mechanism SATA has a soft price-stabilization mechanism, though this is not a legally obligated peg. Strive aims for an intended range of $99 to $101 per share for SATA, as of March 11 . Strive also said it does not intend to issue new SATA through ATM or follow-on offerings below $100. Here’s how it works. If SATA trades below the target range, Strive can raise the dividend rate to increase the yield and support the price. If SATA trades above the range, Strive can lower the dividend rate to reduce the yield and pull the price back down. There are some restrictions on downward resets: Strive generally cannot reduce the rate by more than 25 basis points plus a SOFR-related adjustment and the rate cannot be cut below the one-month SOFR rate. Also, the company cannot reduce the rate unless prior accumulated dividends have been paid or set aside. Strive says it may abandon the target-range approach at any time without preferred-holder consent, and it may adjust the rate for reasons unrelated to Bitcoin value, credit spreads, or interest rates. So far since March 11, when the range was set to $99 – $101, it has been quite stable. SATA price (Seeking Alpha) New Daily Dividends Strive recently rebranded to the “ Daily Dividend Company ” because it will pay SATA dividends each business day starting June 16, 2026, to holders of record on the prior business day. The company declared $0.0542 per share for each business day from June 16 through June 30, representing the same 13% annual rate. This type of dividend policy is truly unprecedented in capital markets. Realty Income had made a name for itself as the “Monthly Dividend Company,” but Strive is taking it further. I believe this new cadence improves security in several interesting areas. First and most obviously, cash comes back faster which enables faster compounding for the investor who reinvests dividends. Second, because the dividend is paid daily, SATA’s share price will reflect less movement from the smaller daily ex-dividend adjustment. This could yield some perception benefits. Third, and this is more speculative, is that the lack of mark to market volatility from daily dividend payouts could make the options market for SATA especially interesting. This would be a daily compounding structure, which is the closest we have ever seen to the continuous dividends assumptions of the Black Scholes model. I am not completely sure what this means or even if it will be consequential, but I thought this was a very interesting fact that should be noted. Perhaps implied volatility could compress and call options can freely be traded close to the at-the-money price but not have to worry about assignment. Dividend Suspension Protections SATA’s dividend protections are stronger than a normal preferred. To begin, the dividend is cumulative. If Strive skips a dividend, the unpaid amount remains part of the accumulated dividend claim. There is also a penalty feature. If an unpaid dividend remains outstanding, the unpaid amount begins accruing compounded dividends. The penalty rate starts at the regular dividend rate plus 25 basis points, then rises another 25 basis points per month, capped at 20% per year. So for example, at today’s 13% rate, unpaid dividends would start compounding at 13.25%, then 13.50%, then 13.75%, and so on. The penalty applies to unpaid dividend amounts, not the full $100 stated amount. Holders cannot seize Bitcoin or force principal repayment. Still, non-payment becomes increasingly expensive for the company, to the benefit of the SATA investor. Preferred holders may also receive director election rights after prolonged non-payment events. Valuation Supports A Buy At roughly $97, SATA offers a double-digit current yield and a path back to par thanks to the dividend adjustment that will be done if required. A move from $97.32 to $100 adds about 2.8% of price upside. Add the 13% dividend rate, and the one-year simple return can reach the mid-teens if the rate holds and the shares return to the stated amount. On top of that, the cumulative dividends and penalty compounding all make SATA stronger than a standard preferred for long term holding. A Hold rating would fit better above $100, with lower dividend support, faster preferred issuance, or weaker coverage due to adverse Bitcoin price action. Risks Bitcoin downside is the largest risk. SATA holders rank ahead of common equity, but the main economic support is still a massive Bitcoin balance sheet. A sharp BTC drawdown can compress asset coverage quickly. If confidence in this coverage breaks, SATA will trade like distressed credit, possibly at a sizable discount to par. Dividend discretion is the second risk. The dividend is cumulative, but the board must still declare it. If declarations stop or legal capacity becomes constrained, holders move from income collection to arrearage enforcement. Furthermore, Strive has no legal obligation to assure a $100 trading price. While they have worked to ensure it and their communications have been focused on emphasizing this feature, the fact is that the Board may choose another path that is in the best interest of the company. Therefore, we cannot deny that the variable rate might get lowered even if it might break the $100 target price. This may happen during times of extreme market stress. A related risk to this is that if SATA becomes extremely popular, the company likely will reduce the dividend if doing so would not upset the trading target. Capital structure growth is another risk. New SATA or parity preferred can fund more assets, but it also creates new equal-ranking claims. Issuance quality will determine whether new capital strengthens or dilutes the preferred cushion. At this time, the company indicates that SATA is the only preferred security it plans to issue and that it plans to make it the most senior security in the capital structure. The Bottom Line I view SATA as a Buy below $100. The 13% dividend is attractive. The daily payment cadence improves the cash-flow profile for investors and the overall reputation of the company. The cumulative dividend claim, penalty compounding, and governance backstop give holders more protection than a standard preferred. Around $97, the yield, coverage, and path back to par create a favorable speculative income setup.

