


News
3 Jun 2026, 12:01
Bitcoin hits Power Law level low that historically precedes a rebound
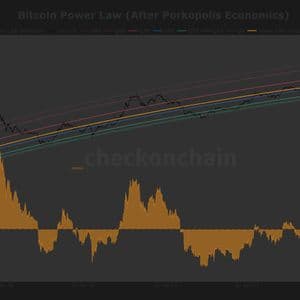
The power law model shows BTC trading at one of its deepest discounts relative to trend, a level previously seen during the March 2020 crash and FTX collapse.
3 Jun 2026, 12:00
BNB Chain, CoinMarketCap, and Trust Wallet Launch $36,000 BNB HACK: AI Trading Agent Edition

Dubai, UAE, June 3rd, 2026, Chainwire BNB Chain , CoinMarketCap , and Trust Wallet today opened registration for BNB HACK: AI Trading Agent Edition, a three-week, $36,000 hackathon competition challenging builders to ship AI agents that read the market, decide, and execute on-chain end-to-end. Running June 3 to 21 with judging the following week, the event spans two tracks (Autonomous Trading Agents and Strategy Skills) and asks teams to combine a production-grade stack rather than reinvent it: CoinMarketCap for data and signal, Trust Wallet for self-custody execution, and BNB Chain for the on-chain venue. At the center of that stack is the CMC Agent Hub, which gives competing agents structured, decision-ready access to live crypto data instead of raw API output. Rather than parsing massive JSON responses, an agent calls the Hub and receives pre-computed signals and analyst-grade insight, including market regime, liquidity, ETF demand, cross-asset pressure, and risk flags, in a compact, LLM-friendly format. Across two tracks, the Agent Hub is the layer that turns market noise into the signals an agent can actually act on, whether that means triggering a trade through Trust Wallet's Agent Kit, rotating positions as narrative shifts, or generating a back-testable strategy from the Skills Marketplace. Builders can connect through a single MCP endpoint exposing twelve professional data tools, through keyless x402 pay-per-request access, or through the CLI and IDE integrations, and can route queries to more than 190 reusable Skills covering everything from daily market overviews to on-chain token analysis. The format is deliberate: pre-computed indicators and timestamped outputs reduce token burn and hallucination risk, letting teams spend their three weeks on agent logic rather than data plumbing. The $36,000 pool spreads across nine main placements and three sponsor special prizes, with winners also eligible for API credits, Claude API compute, mentorship, Kickstart consideration, and a Trust Wallet Developer Portal listing. The hackathon is open to solo builders and teams aged 18 and up; at least one sponsor capability is required, and projects using all three score highest with judges. Registration is open now on DoraHacks , with full details at CMC Agent Hub . About CoinMarketCap CoinMarketCap stands as the Home Of Crypto. With over 1 billion monthly page views and 38 million tracked cryptocurrencies, CoinMarketCap drives the industry forward by organizing and delivering comprehensive crypto intelligence. Major media outlets including Forbes, Bloomberg, CNBC, and The Wall Street Journal rely on CoinMarketCap as their primary source for crypto data. ContactMarketing ManagerMin [email protected] Disclaimer: This is a sponsored press release and is for informational purposes only. It does not reflect the views of Crypto Daily, nor is it intended to be used as legal, tax, investment, or financial advice.
3 Jun 2026, 12:00
ISM Services PMI in Focus: Will Wednesday’s Data Shake the US Dollar?

BitcoinWorld ISM Services PMI in Focus: Will Wednesday’s Data Shake the US Dollar? The US Dollar is bracing for a potentially volatile session on Wednesday as traders turn their attention to the latest ISM Services PMI report. This monthly gauge of activity in the services sector—which accounts for the vast majority of US economic output—is widely regarded as a critical input for both market sentiment and Federal Reserve policy expectations. What to Expect from the ISM Services PMI Economists polled by major financial news outlets forecast the headline index to come in near 52.5, a reading that would indicate continued expansion, albeit at a modest pace. A print above 50 signals growth, while below 50 points to contraction. The previous month’s reading stood at 52.7, suggesting the sector has been holding steady in expansionary territory. However, the market’s reaction will likely hinge on the subcomponents—particularly the employment and new orders indexes. A stronger-than-expected employment reading could reinforce the view that the labor market remains resilient, potentially reducing the urgency for the Federal Reserve to cut interest rates. Conversely, a weak services print could reignite recession fears and increase bets on a more accommodative Fed. Why This Matters for the US Dollar The US Dollar Index (DXY) has been trading in a relatively tight range in recent weeks, as markets digest mixed signals from the economy. A robust ISM Services PMI would likely boost the greenback, as it would suggest the economy is still running hot enough to keep the Fed on hold. On the other hand, a disappointing number could trigger a selloff in the dollar, as traders price in a higher probability of rate cuts later this year. Currency markets have been particularly sensitive to US data releases this year, given the ongoing debate about the timing and pace of the Fed’s next move. The services sector, which includes everything from healthcare to retail to finance, is a bellwether for overall economic health. Any sign of weakness here could have ripple effects across global currency pairs. Fed Policy Implications The Federal Reserve has repeatedly emphasized that its decisions will be data-dependent. With inflation still above the 2% target but showing signs of cooling, the ISM Services PMI provides a real-time snapshot of demand conditions. A strong services reading could give the Fed cover to maintain its current stance, while a weak one might open the door for a rate cut as soon as the next meeting. Traders will also watch for any commentary from Fed officials following the release. Even a subtle shift in tone could amplify the market’s reaction. Conclusion Wednesday’s ISM Services PMI is more than just another data point—it is a potential catalyst for the next directional move in the US Dollar. Whether the report confirms resilience or reveals cracks in the services sector, traders should prepare for heightened volatility. As always, the actual number and its components will tell the full story. FAQs Q1: What is the ISM Services PMI? The ISM Services PMI is a monthly survey of purchasing managers in the US services sector, measuring business activity, new orders, employment, and prices. It is a key indicator of economic health. Q2: How does the ISM Services PMI affect the US Dollar? A strong reading tends to boost the US Dollar by signaling economic strength and reducing the likelihood of Fed rate cuts. A weak reading can weaken the dollar by raising expectations of monetary easing. Q3: When is the ISM Services PMI released? The report is typically released on the first business day of each month at 10:00 AM ET by the Institute for Supply Management (ISM). This post ISM Services PMI in Focus: Will Wednesday’s Data Shake the US Dollar? first appeared on BitcoinWorld .
3 Jun 2026, 11:59
Bitcoin’s AI Stock Problem: Why BTC Is Losing the Risk-On Competition Again

Investors are asking a blunt question: why are AI stocks running while Bitcoin stalls? This piece lays out what changed in flows and fundamentals, how the “risk-on” baton shifted to semiconductors, and what would need to turn for BTC to lead again. You’ll see how ETF dynamics, earnings visibility, and macro liquidity interact. We’ll also map the key indicators to watch, common mistakes to avoid, and practical checklists to navigate the AI-versus-Bitcoin tape in 2026. Quick Answer Editor's note: The day NVIDIA posted its blowout print, several traders I speak with rotated capital into semis, and by late May the Bitcoin ETF flow tape softened noticeably. On-chain signals looked fine, but the marginal buyer was busy chasing earnings momentum. I’ve kept positions smaller in crypto when ETF prints turned choppy and only sized up again after a few sessions of consistent creations and improving breadth. The lesson: flows and earnings cadence now share the same steering wheel. — Lena Carter Bitcoin is losing the risk-on race to AI equities because capital is favoring earnings-backed momentum and clearer cash-flow visibility just as crypto flows soften. U.S. spot Bitcoin ETF demand cooled in May while AI leaders posted blockbuster quarters, pulling incremental risk capital toward semiconductors. The rotation could reverse if ETF inflows re-accelerate, macro liquidity improves for crypto, or AI froth broadens into less profitable names. AI megacaps printed record results, intensifying momentum in semiconductors. Bitcoin ETF flows flipped to outflows in May, pressuring spot demand. Macro sensitivity differs: equities have earnings levers; BTC relies on flows/liquidity. Reversal triggers include ETF creations, improving crypto liquidity, and weaker AI breadth. Why are AI stocks outrunning Bitcoin right now? The simplest answer is earnings. AI bellwethers continue to post exceptional results and offer credible forward guidance, turning the AI buildout into a tangible cash-flow story. In May, NVIDIA reported record quarterly revenue of $81.615 billion with guidance for $91.0 billion next quarter, a staggering pace that reaffirms data-center demand for AI accelerators ( NVIDIA / SEC press release ). Momentum intensified into early June. On June 3, the Philadelphia Semiconductor Index advanced roughly 5.9% while Bitcoin fell about 5.7% the same day—an intraday split signaling rotation toward AI/semis as crypto softened ( Reuters ). When semis rip on real earnings, quant and discretionary desks often increase exposure, and passive flows chase benchmarks—further compounding the move. Bitcoin, by contrast, does not offer quarterly revenue beats. Its bull phases tend to be driven by liquidity, narratives ( Digital gold ), and structural demand from vehicles like spot ETFs. When those flows cool, the asset’s leadership premium can fade. AI’s “show me the money” era is colliding with crypto’s “show me the flows” reality. What do ETF and fund flows tell us about the rotation? Flows confirm the handoff. In the week to May 26, 2026, digital asset investment products recorded US$1.47 billion of outflows, with Bitcoin products accounting for US$1,315 million—Bitcoin’s largest weekly outflow of the year ( CoinShares (weekly fund flows) ). Zooming out, U.S. spot Bitcoin ETFs accumulated only around 4,500 BTC net year-to-date by late May, and flows flipped from accumulation to distribution in May, according to Swissblock data cited by CoinDesk ( CoinDesk (Swissblock data) ). This matters because spot ETFs translate investor appetite directly into spot buys or sells, impacting price discovery more immediately than futures-based products. Mechanically, when ETF creations slow or redemptions pick up, market makers hedge less spot BTC. The liquidity impulse that once lifted the market—particularly during early 2026—can reverse, pressuring price and volatility. Put differently: as AI equities secure incremental demand via earnings and index momentum, Bitcoin faces a temporary demand vacuum if ETF and fund flows stall. Is Bitcoin still macro risk or hedge in 2026? Bitcoin’s role remains regime-dependent. In liquidity-rich phases—falling real yields, central bank balance-sheet expansion, or credit spreads compressing—BTC tends to behave like high-beta tech. In tightening or ambiguous liquidity backdrops, correlations can weaken or flip, and BTC may underperform cash-generative equities that can grow through the cycle. “ Digital gold ” narratives coexist with “high-beta risk” behavior. Over multi-year horizons, supply discipline and decentralization support a store-of-value thesis. Over tactical horizons, however, Bitcoin’s path is often set by flows, risk appetite, and funding conditions. That’s why a month of ETF outflows can matter more to near-term prices than any halving model. For allocators, the takeaway is not to force a single label. Treat BTC as a macro-sensitive asset whose beta and correlation shift with liquidity and narrative dominance. Hedge or size positions accordingly, and use leading flow indicators rather than static assumptions. Which catalysts could let BTC reclaim leadership from AI equities? Leadership can and does rotate. What might flip it back toward BTC? Spot ETF re-acceleration: Sustained net creations across multiple funds over several weeks. Improving crypto liquidity: Tighter spot-futures basis, healthier order-book depth, growing stablecoin float . Macro tailwinds: Declining real yields, clearer rate-cut trajectories, or a softer dollar. Narrative sparks: Progress on Bitcoin financialization, custody rails at major banks, or broader institutional mandates. AI breadth fatigue: If semis leadership narrows or froth appears in unprofitable AI names, rotation often seeks other risk assets. Pro tip: Watch when semis rally but advance/decline breadth within the sector deteriorates and volatility rises. Leadership turns often start at the edges before index-level momentum cracks. None of these are guarantees; they are plausible pathways. The point is to map conditions where Bitcoin’s structural scarcity and global liquidity sensitivity can reassert themselves relative to an AI trade that is currently earnings-powered and consensus-long. How do valuation frameworks differ: earnings vs scarcity? AI equities and Bitcoin live under different valuation umbrellas. One is discounted cash flow and capacity expansion; the other is a scarce, non-cash-flowing asset whose demand surges in liquidity upcycles. Comparing them clarifies why each leads in different regimes. DimensionAI Megacaps / SemisBitcoinPrimary DriverEarnings growth, margins, capex cycles, market shareNet flows (ETFs, stablecoins), macro liquidity, adoption narrativesValuation LensDCF, multiples, unit economicsStock-to-flow, scarcity, relative demand vs supply issuancePolicy SensitivityExport controls, subsidies, antitrustRegulation, taxation, KYC/AML, exchange/custody rulesMacro BetaCyclical, but cushioned by earnings visibilityHigh-beta to liquidity; can decorrelate in stressInvestor BasePassive indexers, mutual funds, hedge funds, retailETFs, crypto-native funds, family offices, global retailKey CatalystsProduct cycles, hyperscaler demand, gross margin trendsETF creations/redemptions, stablecoin issuance, regulatory clarity When earnings visibility is abundant and flows into AI remain one-way, equities deserve their premium. When liquidity loosens and crypto demand instruments re-accelerate, Bitcoin’s scarcity narrative regains pricing power even without cash flows. What should diversified investors watch week to week? Rather than guessing the next leadership switch, track a repeatable set of indicators. This isn’t about calling tops; it’s about catching the turn with confirmation. ETF and ETP flows: Daily creations/redemptions across U.S. spot Bitcoin funds and European products. Stablecoin supply: Net issuance trends as a proxy for crypto-native liquidity. Basis and funding: Futures basis normalization and funding rate health (excessive positive funding can precede pullbacks). Order-book depth: Resilient spot depth on major exchanges signals improved two-way liquidity. Macro: Real yields, DXY, and front-end rate expectations; crypto tends to like lower real yields and a softer dollar. Semis breadth and volatility: If SOX rallies while breadth narrows and vol rises, rotation risk increases. Options skew: Persistent call skew in semis and put skew in BTC can foreshadow a cross-asset reversal. Miner behavior: Elevated miner selling or hash-price stress can weigh on BTC rallies; stabilization helps. Pair these with scenario planning. If two or more crypto-specific indicators flip constructive while AI breadth wanes, the odds of Bitcoin reclaiming leadership improve materially. Swissblock Risk Index & US spot BTC ETF net flows (May 2026) — shows ETF flows flipping to net outflows in May and the Risk Index moving into 'high-risk' territory, illustrating the institutional demand weakness behind Bitcoin's recent underperformance. — Source: Swissblock chart (published in CoinDesk) How do recent rotations fit a bigger cycle? Cross-asset leadership typically rotates through phases: liquidity beta (early cycle), earnings leadership (mid cycle), and defensive or carry (late cycle). AI semis currently dominate the earnings-led phase, with hyperscaler capex as a durable driver. Crypto often excels in the liquidity-led windows before and after such earnings surges, especially when policy uncertainty subsides. The May–June split between semis strength and Bitcoin softness fits this pattern. With CoinShares flagging the largest weekly Bitcoin product outflow of 2026 in late May and semis surging days later, we are living through a textbook re-pricing of where incremental dollars feel “safer” in risk assets—namely, where cash flows are immediate ( CoinShares (weekly fund flows) ; Reuters ). That does not mean Bitcoin’s cycle is over; it means the baton is temporarily elsewhere. Rotation risk works both ways, and the same desks that rotate out can rotate back when conditions line up. Common Mistakes Chasing semis after parabolic days: Buying strength is a strategy, but crowding risk is real. Use breadth and sector volatility to avoid late entries. Forcing a single Bitcoin narrative: Treating BTC only as “digital gold” or only as “tech beta” misses regime shifts. Let flows and macro set your framing. Ignoring ETF microstructure: Creations/redemptions drive spot liquidity. Don’t rely solely on price; monitor daily flow prints. Overleveraging on funding spikes: High positive funding can precede mean reversion. Keep leverage modest when perp markets get frothy. Neglecting stablecoin data: Shrinking stablecoin float can telegraph weaker crypto demand; expanding float can precede rallies. For deeper cross-asset coverage and timely market features, visit Crypto Daily . Frequently Asked Questions Does AI strength automatically mean Bitcoin must fall? No. There are periods when both rise on broad risk appetite. The current divergence reflects where incremental dollars see the cleanest near-term payoff: earnings-backed AI vs. flows-sensitive BTC. Both can rally if macro liquidity improves. Are Bitcoin ETF outflows a long-term red flag? They are a short-term headwind, not destiny. Sustained creation trends over multiple weeks would be a healthier signal than one strong day. Context—macro, spreads, and stablecoins—matters as much as the headline number. How might a policy surprise impact the rotation? Clearer crypto rules or custody improvements at large financial institutions could unlock sidelined mandates. Conversely, restrictive measures could extend the rotation toward AI equities. Policy remains a two-way catalyst. What if AI hardware demand slows? If hyperscaler capex moderates or supply constraints ease faster than expected, semis margins and growth expectations may cool. In that scenario, performance-chasing capital often seeks other risk assets, and BTC could benefit—especially if crypto flows improve simultaneously. Do halvings still matter if flows dominate? Yes, but mostly as a backdrop. Halvings reduce structural sell pressure, which can amplify bull markets when demand is rising. Without demand, the effect is subtle; with demand, it can be powerful. Could ETH or other tokens capture the AI bid instead? Possibly, if the market interprets certain networks as AI-aligned (data markets, compute coordination) and if liquidity rotates across the crypto complex. But broad crypto leadership still tends to hinge on Bitcoin’s flows and macro tone. Is the June split between semis and BTC just noise? One day doesn’t make a trend, but it fit a multi-week pattern: AI enthusiasm on strong earnings and Bitcoin’s softening ETF demand. Watch whether that pattern persists or snaps on renewed crypto inflows. Disclaimer: This article is provided for informational purposes only. It is not offered or intended to be used as legal, tax, investment, financial, or other advice.
3 Jun 2026, 11:50
Arthur Hayes Sets $10 Price Target for Worldcoin (WLD) as Token Surges 22%
BitcoinWorld Arthur Hayes Sets $10 Price Target for Worldcoin (WLD) as Token Surges 22% BitMEX co-founder Arthur Hayes has publicly endorsed Worldcoin (WLD), sharing a price chart on X (formerly Twitter) and setting a bold $10 price target for the token. The announcement comes amid a significant rally for WLD, which has risen approximately 22% over the past 24 hours and 45% over the past seven days. At the time of reporting, Worldcoin is trading at $0.5161, representing a substantial gap from Hayes’ target. Hayes’ Endorsement and Market Reaction Hayes, known for his influential market commentary and co-founding the BitMEX cryptocurrency exchange, posted a chart on X indicating a technical setup that he believes could propel WLD to $10. This price target implies a potential upside of over 1,800% from current levels. The market reacted swiftly, with WLD experiencing a sharp increase in trading volume and price immediately following the post. While Hayes has a history of making high-profile predictions, his calls have been mixed, and investors should approach such targets with caution. Understanding Worldcoin (WLD) Worldcoin is a cryptocurrency project co-founded by Sam Altman, CEO of OpenAI, with the ambitious goal of creating a global identity and financial network. The project uses biometric verification through its ‘Orb’ device to issue a unique digital identity, with WLD serving as its native token. Despite its innovative premise, Worldcoin has faced regulatory scrutiny in several jurisdictions over privacy concerns related to its iris-scanning technology. The token has experienced significant volatility since its launch, with its price fluctuating widely amid changing market sentiment and regulatory developments. Market Context and Implications The broader cryptocurrency market has shown mixed signals in recent weeks, with Bitcoin and Ethereum consolidating after a period of volatility. Hayes’ endorsement of WLD adds a notable voice to the altcoin’s narrative, potentially attracting speculative interest. However, the $10 target is highly ambitious and would require a massive influx of capital and sustained buying pressure. Traders should consider the inherent risks, including potential sell-offs following celebrity endorsements and the token’s relatively low liquidity compared to major cryptocurrencies. The 45% weekly gain already priced in suggests that some market participants are betting on continued momentum, but profit-taking could emerge at any time. Conclusion Arthur Hayes’ $10 price target for Worldcoin has injected fresh volatility into the token, driving a significant short-term rally. While the endorsement highlights growing interest in the project, the wide gap between the current price and the target underscores the speculative nature of such predictions. Investors should conduct their own research and remain aware of the regulatory and market risks associated with Worldcoin before making any trading decisions. FAQs Q1: Is Arthur Hayes’ $10 price target for WLD realistic? A1: The target represents an over 1,800% increase from current levels, which is highly speculative. While possible in a bullish market scenario, it depends on significant adoption, favorable regulations, and sustained buying pressure. Investors should view it as an opinion rather than a guarantee. Q2: What is Worldcoin and why is it controversial? A2: Worldcoin is a cryptocurrency project that uses iris-scanning technology to create a unique digital identity. It has faced privacy concerns and regulatory investigations in countries like Kenya, Germany, and the UK over how it collects and stores biometric data. Q3: How has WLD performed historically? A3: Since its launch, WLD has experienced high volatility, reaching an all-time high of around $11.82 in March 2024 before declining significantly. The token’s price is influenced by market sentiment, regulatory news, and endorsements from prominent figures. This post Arthur Hayes Sets $10 Price Target for Worldcoin (WLD) as Token Surges 22% first appeared on BitcoinWorld .
3 Jun 2026, 11:48
XRP celebrates 14th anniversary but a key technical debate sets the crypto community abuzz! What happened?

🚨 XRP’s 14th anniversary triggers a fierce debate over missing early records. 🎉 Brad Garlinghouse calls community involvement a top honor while critics challenge the official founding date. 🕵️♂️ Doubts grow as the first seven months of $XRP ledger data remain lost. Continue Reading: XRP celebrates 14th anniversary but a key technical debate sets the crypto community abuzz! What happened? The post XRP celebrates 14th anniversary but a key technical debate sets the crypto community abuzz! What happened? appeared first on COINTURK NEWS .


