


News
28 May 2026, 11:41
BlackRock’s Bitcoin ETF records largest net outflow since January

BlackRock , the world’s largest asset manager, has recorded the second-largest single-day outflow in the history of its Bitcoin ( BTC ) fund launched in 2024. Specifically, the iShares Bitcoin Trust ETF ( IBIT ) posted $527.8 million in redemtpions on May 27, judging by the SoSoValue data available at press time. The figure was only surpassed by the $528.3 million pulled on January 30, with ‘only’ $500,000 needed to break the record. U.S. spot Bitcoin ETFs collectively recorded $733.4 million in net outflows the same day. Alongside BlackRock, Grayscale’s GBTC fund saw the biggest losses, shedding $104.8 million, followed by Fidelity’s FBTC, which shed $60.30 million. Morgan Stanley’s MSBT fund was the only one with a positive net change, adding $4.3 million. Overall, the figure represented the biggest collective daily outflow for institutional holders since January 29, 2026. BlackRock daily Bitcoin flows. Source: SoSoValue Bitcoin price drops as BlackRock posts record outflows The flagship cryptocurrency reacted negatively to the institutional outflows, dropping nearly 3.4% and trading at $73,310 at the time of writing. The decline is all the more notable considering that President Donald Trump has promised to codify the Clarity Act . 24-hour BTC price. Source: Finbold Spot ETF redemptions coincided with a sharp derivatives market unwind, as more than $296 million in Bitcoin long positions had been liquidated within 24 hours – a 185% surge in forced closures. One day earlier, on May 27, BTC had already dropped nearly 2%, its market cap slipping by nearly $30 billion, fueled by another notable sale from an IBIT investor via a dark pool. Spot Bitcoin ETFs are now on their eighth straight day of net losses. Their overall net balance sits around $96.45 billion, with BlackRock alone commanding about $59.48 billion, or 3.94% of the total BTC supply. Featured image via Shutterstock The post BlackRock’s Bitcoin ETF records largest net outflow since January appeared first on Finbold .
28 May 2026, 11:38
Ripple Moves 60 Million XRP Amid Sharp Price Dip

Ripple moves over $79 million worth of XRP to an unknown wallet as the market faces extreme volatility with XRP falling below $1.30.
28 May 2026, 11:24
Shiba inu exits hit 580b tokens as spot trading surges 283%

🚨 580 billion $SHIB tokens just exited major exchanges. Spot trading in $SHIB exploded, jumping 283% in days. Continue Reading: Shiba inu exits hit 580b tokens as spot trading surges 283% The post Shiba inu exits hit 580b tokens as spot trading surges 283% appeared first on COINTURK NEWS .
28 May 2026, 11:21
Bitcoin Price Today: BTC Sinks Below $73,000 as US-Iran Trade Fresh Strikes

Bitcoin price fell below $73,000 on Thursday as renewed U.S.-Iran hostilities weakened risk appetite and pushed traders back into defensive positioning. BTC dropped to about $72,500 before recovering to near $73,303 as of press time, down 3.54% in the last 24 hours. The decline followed fresh military actions between Washington and Tehran, which tested the fragile ceasefire and reduced market hopes for a near-term peace agreement. Iran’s Islamic Revolutionary Guard Corps said it targeted a U.S. air base after U.S. strikes hit Iranian drones and a launch site near the Strait of Hormuz. The latest move also came as crypto sentiment weakened sharply. The Crypto Fear & Greed Index fell to 22, returning to the “Extreme Fear” zone. Market data showed more than 166,000 traders were liquidated over the past 24 hours, with total liquidations reaching about $932 million. US-Iran Strikes Pressure Risk Assets The conflict around the Strait of Hormuz remains a key market concern because the waterway is one of the world’s most important oil transit routes. Oil prices rebounded after the fresh strikes, reversing prior losses linked to reports of progress in peace talks. Brent crude rose about 2.5% to $96.63 per barrel, while West Texas Intermediate climbed to about $90.93. The rebound showed that traders are still pricing risk around energy flows, even as crude remains below the highest levels seen earlier in the conflict. As we reported, the White House also rejected Iranian state media claims about a draft memorandum of understanding. The reported draft said the U.S. would lift its naval blockade and that Iran would restore commercial shipping through the Strait of Hormuz within one month. U.S. officials called the report false. President Donald Trump said he would not be rushed into a deal and warned that Iran’s efforts to delay negotiations would not change his position. The uncertainty added pressure to global equity futures and crypto markets, both of which had been reacting to changing headlines around the peace process. Bitcoin Price Loses $74,000 Support Bitcoin’s technical structure weakened after BTC lost the $74,000 support zone. That level now becomes short-term resistance, and traders are watching whether Bitcoin can reclaim it to reduce bearish pressure. According to crypto analyst Ted, the BTC price rejected near $81,453 before slipping below $78,921 and then breaking under $75,000. This sequence shows that sellers have taken control in the short term after the failed recovery attempt. Source: X The first support zone is near $73,300 to $73,400, where BTC is currently trading. If buyers fail to defend this area, the next major level sits near $70,671. A break below $70,671 would weaken the structure further and could open the way toward the $66,318 to $65,816 demand zone. On the upside, the Bitcoin price needs to move back above $75,000 before a stronger recovery can develop. Above that, resistance sits near $78,921 and $81,453. A daily close above $81,453 would improve the short-term structure and could allow BTC to revisit the $84,000 to $85,000 range. Higher resistance remains near $90,235 and $97,899, but those levels are not active targets unless Bitcoin first regains the lower resistance zones. Bitcoin On-Chain Activity and Leverage Raise Caution Bitcoin network activity has also cooled. Data shared by analyst Ali Martinez showed active addresses fell 39.80% over two weeks, dropping from 821,000 to 494,000. Lower activity during price consolidation often shows reduced participation from short-term traders. At the same time, Binance market data shows a fragile setup beneath the surface. Taker buy volume has been falling for months, meaning fewer traders are aggressively buying Bitcoin at market prices. This points to weaker spot demand during the recent recovery attempt. Source: CryptoQuant Funding rates on Binance have moved back into positive territory, showing that derivatives traders are still leaning long despite falling price momentum. When leveraged long positioning rises while spot demand weakens, the market can become vulnerable to forced liquidations. That setup was visible in the latest market move, with nearly $1 billion in crypto liquidations reported over 24 hours. If Bitcoin fails to regain $75,000, traders may continue watching the $71,000 to $73,000 area as the key zone for a bounce.
28 May 2026, 11:16
Google Engineer Arrested For Using Company’s Own Search Data To Win $1.2 Million On Polymarket

A Google information security engineer has been arrested and charged with commodities fraud, wire fraud, and money laundering after allegedly using confidential internal company data to place a series of bets on Polymarket — the crypto-based prediction market platform — winning approximately $1.2 million by knowing the outcomes of his wagers before the trading public did. The US Attorney’s Office for the Southern District of New York unsealed the complaint against Michele Spagnuolo, 36 — also known by his Polymarket account alias “AlphaRaccoon” — on May 27, 2026. Spagnuolo, an Italian citizen residing in Switzerland, was arrested in New York and appeared before US Magistrate Judge Sarah Netburn, where he was released on a $2.25 million bond secured by $1 million in cash, per the DOJ’s official statement. He did not enter a plea. How The Scheme Worked According to the unsealed complaint , Spagnuolo had access to an internal Google software tool — bearing a banner marked “Google Confidential” in red text — that provided real-time visibility into what users were searching across Google’s platform, including data that fed directly into Google’s annual “Year in Search” rankings, per the DOJ filing. Beginning in May 2024, Spagnuolo created a Polymarket account and began placing bets on contracts tied to which individuals would rank on Google’s most-searched list for 2025 — markets Polymarket launched last fall, per the complaint. Prosecutors allege Spagnuolo transferred approximately $3.8 million in USDC to his Polymarket address and placed bets including a $381.12 “yes” wager that the artist d4vd would rank in Google’s most-searched list and correctly predicted contracts such as “Will Zohran Mamdani rank in the Top 5 most searched” and “Will Squid Game be the number one searched TV show,” per CNBC’s reporting of the complaint. His success rate across these markets was, according to the complaint, no accident. He knew the answers before the markets settled. The CFTC filed a simultaneous civil case against Spagnuolo seeking monetary disgorgement, restitution, and additional penalties, per the complaint. Google confirmed it had placed Spagnuolo on leave and was cooperating with law enforcement — noting that the tool he used was technically available to all employees, but that using confidential information to place bets represented a serious breach of company policy, per a statement reported by ABC News. The Second Case In Thirty Days The Spagnuolo arrest is the second federal criminal case tied to Polymarket insider trading in just over a month. In April 2026, US Army Special Forces Master Sergeant Gannon Ken Van Dyke was arrested for allegedly using classified military knowledge of the planned capture of Venezuelan President Nicolás Maduro to place bets on Polymarket, reportedly netting more than $400,000. Van Dyke has pleaded not guilty, per CNN’s reporting. Polymarket’s chief legal officer Olivia Chalos said in a statement that the company worked closely with the US Attorney’s Office and the CFTC on the Spagnuolo case — noting that Polymarket is the only prediction platform to date whose cooperation has led to insider trading charges in the United States, and that the blockchain-based nature of the platform means bad actors leave footprints. This development marks a critical and accelerating moment for the nascent prediction market sector. Two federal insider trading arrests in thirty days — one involving military classified information, the other corporate search data — arriving simultaneously with an active congressional investigation into Polymarket and Kalshi, confirms that the legal perimeter around prediction markets is closing fast. The transparency of blockchain trading, once seen primarily as a feature for users, is now functioning as a forensic trail for federal prosecutors. Cover image from Grok, ETHUSD chart from Tradingview
28 May 2026, 11:05
Bitcoin Slides Under $73K as CME Kills Weekend Gap and Kraken Debuts BTC Yield Vault
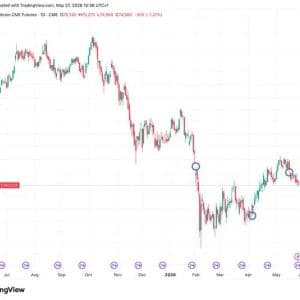
Bitcoin News CME Group's Bitcoin futures and options shifted to round-the-clock trading on Globex starting Friday, eliminating the long-standing weekend pause that previously created sharp pricing ...


