


News
9 Jun 2026, 08:43
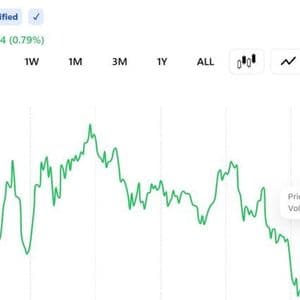
Wall Street firm maps Bitcoin’s path to $150,000 by end of 2026

Bernstein has reaffirmed its bullish Bitcoin ( BTC ) price prediction for 2026, arguing that the cryptocurrency remains on track to reach $150,000 despite a slowdown in capital inflows and weaker retail participation. According to the Wall Street brokerage, Bitcoin’s recent decline is primarily due to reduced investment flows rather than concerns about its long-term fundamentals. The firm maintained that Bitcoin’s role as a store of value remains intact, even as investors increasingly direct capital toward artificial intelligence-related stocks. As of press time, Bitcoin was valued at $62,902, about 50% below its record high of $126,000 reached in October 2025. Bitcoin one-week price chart. Source: Finbold The cryptocurrency recently fell to its lowest level in more than two months amid continued outflows from spot Bitcoin exchange-traded funds ( ETFs ) and broader macroeconomic uncertainty. Bernstein noted that net inflows into Bitcoin through spot ETFs and corporate treasury companies have totaled approximately $12 billion so far in 2026, a sharp decline from the $60 billion recorded during all of 2025. Impact of corporate participation on Bitcoin price While Bitcoin ETF flows have weakened, the brokerage highlighted that net ETF outflows amount to only about $2.6 billion year-to-date from roughly $75 billion in assets under management. The firm pointed to continued accumulation by corporate buyers, particularly companies following the Bitcoin treasury strategy pioneered by Strategy. Despite weaker flows, Bernstein argued that Bitcoin’s market structure has become significantly stronger than in previous cycles. Ownership is now distributed across ETF investors, corporate treasuries, wealth management platforms, broker-dealers, institutional funds, pension funds, and sovereign investors. This diversification marks a significant shift from earlier market cycles that were heavily driven by retail speculation. Bernstein argued that Bitcoin’s lack of retail momentum is not a concern, as many investors have shifted their focus to AI stocks . The brokerage believes Bitcoin has matured into a more institutionally driven asset, reducing its reliance on retail speculation. “This maturation phase of Bitcoin is less appreciated, and the criticism has largely come from its lack of retail momentum, which may not be a bad thing considering retail has crowded into AI. Bitcoin being boring this cycle should not be held against it and does not take away from the long-term ‘store of value’ thesis, in our view,” the analysts noted. While weaker capital inflows have weighed on prices, Bernstein views the slowdown as temporary rather than a structural weakness. The firm maintained that growing institutional ownership, continued Bitcoin ETF adoption, and Bitcoin’s role as a store of value support its long-term outlook. The post Wall Street firm maps Bitcoin’s path to $150,000 by end of 2026 appeared first on Finbold .
9 Jun 2026, 08:40
US Dollar Index Forecast: Rising 20-Day EMA Bolsters Bullish Technical Setup

BitcoinWorld US Dollar Index Forecast: Rising 20-Day EMA Bolsters Bullish Technical Setup The US Dollar Index (DXY) continues to trade above its rising 20-day exponential moving average (EMA), a technical development that reinforces the prevailing bullish bias among market participants. As of the latest session, the index is holding near key resistance levels, suggesting that momentum remains in favor of further upside despite intermittent volatility. Technical Structure and Key Levels The 20-day EMA has acted as dynamic support throughout the recent uptrend, consistently lifting pullbacks and preventing a deeper correction. This pattern is widely interpreted by technical analysts as a sign of sustained buying interest. The index is currently testing the upper boundary of its near-term range, with the next resistance zone located around the 105.00 psychological mark. A decisive break above this level could open the path toward the 105.50 area, a region last tested in early 2024. On the downside, the 20-day EMA, currently near 104.30, serves as the first line of defense. A close below this moving average would signal a weakening of the bullish structure, potentially exposing the 104.00 support level. However, the EMA’s upward slope indicates that the trend remains constructive for dollar bulls. Market Context and Fundamental Drivers The dollar’s resilience comes amid a mixed macroeconomic backdrop. The Federal Reserve’s cautious stance on rate cuts has provided a floor for the currency, while ongoing geopolitical uncertainties continue to drive safe-haven flows into USD-denominated assets. At the same time, competing currencies, particularly the euro and yen, face their own headwinds, which has further supported the DXY’s relative strength. Traders are now focusing on upcoming U.S. economic data releases, including non-farm payrolls and consumer price index readings, which could either validate or challenge the current bullish trajectory. A stronger-than-expected labor market or persistent inflation would likely reinforce expectations of higher-for-longer interest rates, providing additional fuel for the dollar. Implications for Forex Traders For currency traders, the DXY’s technical posture offers a clear framework. The rising 20-day EMA provides a defined risk level for long positions. As long as the index remains above this moving average, the path of least resistance is higher. Conversely, a breakdown below the EMA would warrant a reassessment of bullish strategies. The broader trend also influences major currency pairs. A stronger dollar typically weighs on EUR/USD, GBP/USD, and commodity-linked currencies, while benefiting USD/JPY. Traders should monitor the DXY’s interaction with its EMA as a leading indicator for directional moves in these pairs. Conclusion The US Dollar Index’s ability to hold above its rising 20-day EMA reinforces a technically bullish outlook. While resistance near 105.00 presents a near-term hurdle, the underlying momentum and supportive fundamentals suggest the bias remains upward. Traders should watch for a confirmed breakout or a breakdown below the EMA to gauge the next directional phase. FAQs Q1: What does a rising 20-day EMA indicate for the US Dollar Index? A rising 20-day EMA indicates that the average price over the last 20 trading days is increasing, which typically signals that short-term momentum is bullish and that pullbacks may be bought. Q2: What are the key support and resistance levels for the DXY? Key support is the 20-day EMA near 104.30, followed by 104.00. Key resistance is the psychological 105.00 level, with a breakout targeting 105.50. Q3: How does the DXY’s technical trend affect other currency pairs? A bullish DXY generally pressures EUR/USD and GBP/USD lower, while supporting USD/JPY. The DXY’s trend serves as a macro indicator for directional bias in major forex pairs. This post US Dollar Index Forecast: Rising 20-Day EMA Bolsters Bullish Technical Setup first appeared on BitcoinWorld .
9 Jun 2026, 08:36
Crypto News, June 9: Bitcoin Price Steady, Sam Bankman-Fried Formally Applies for a Trump Crypto Pardon as Humanity Exploited

The Sam Bankman pardon request has been the talking point after the formal filing. Meanwhile, the Humanity crypto project reels from its $32M private-key hack that wiped 80-90% off H in hours. Bitcoin stands strong above $63K as the Fear & Greed Index is locked in extreme fear. Sam Bankman pardon application puts the man back in the headlines two years into his 25-year sentence for FTX fraud. Just last year, Trump granted clemency to crypto figures, including BitMEX co-founder Arthur Hayes, in March. Hayes later faced pump-and-dump accusations on leveraged products after he rebuilt influence through education and trading commentary. WATCH: SAM BANKMAN-FRIED SPEAK FROM PRISON ON SEEKING A PRESIDENTIAL PARDON "It's one of the very few cases where the platform was overcollateralized and customers were made more than whole" "Yet there was not just an investigation but a prosecution and dozens of years of… https://t.co/3GbJvfKnFZ pic.twitter.com/PxcR5zfRrx — Coin Bureau (@coinbureau) June 8, 2026 However, Sam Bankman pardon would reward negligence that cost users billions. Some say it ends selective “war on crypto” prosecutions and shows a regulatory reset. Besides Hayes, Trump has also pardoned CZ Binance and other industry players in a pro-innovation policy move. But then again, the CZ verdict was arguably baseless. SBF’s team cites prison time served and cooperation offers. But the crypto community splits between redemption calls and rug-pull flashbacks. Discover: The best crypto to diversify your portfolio with Forget Sam Bankman Pardon, Today, The Humanity Crypto Exploit Rocks Market The Humanity crypto exploit drained over $32M from 17 foundation wallets via one compromised private key. Attackers minted extra tokens and dumped H for ETH and BNB, crashing the price from $0.70 to under $0.10. Team paused the bridge and liquidity pools, insisting only one member’s keys were hit. Humanity Protocol crashed -90% in 12 hours, erasing over $1 BILLION in market cap, just days after surging +339%. The collapse came after an attacker drained over $31 million from wallets linked to Humanity's app, then started swapping the stolen $H into $ETH . The founder… pic.twitter.com/DXdWXNrh2W — Ash Crypto (@AshCrypto) June 9, 2026 ZachXBT called the Humanity crypto story suspicious, pointing to pre-hack pump, concentrated supply, and market-maker ties. He labeled it likely an inside exit rather than a random hack, offering a bounty for proof. As of now, there is no data to back his claim, just yet. You choose to crime pump your token for weeks with zero fundamentals and think CT will blindly trust your story? Disclose your active MM agreements with the HK entity first…. — ZachXBT (@zachxbt) June 9, 2026 Humanity incident caps a brutal 2026 crypto hack season that already saw Drift Protocol lose $285M, Kelp DAO $293M, and multiple bridges drained for hundreds of millions total. North Korea-linked actors and key compromises dominate the list. This Humanity crypto fallout fuels institutional distrust and explains record ETF outflows topping $4B in recent weeks. BlackRock’s IBIT and Grayscale GBTC led redemptions amid post-exploit FUD. Discover: The best pre-launch token sales Bitcoin Rocking Above $63K Amid Extreme Fear: What’s Next for Crypto? Saylor blamed AI capital rotation for the recent Bitcoin dip; ARCA called it “nonsense” and “gaslighting,” pinning pressure on Strategy’s small BTC sales to cover dividends. Bitcoin bounced above $63K while Strategy added another 1,550 BTC. Spot volumes hit 2023 lows, yet big alts show resilience with BNB and SOL edging higher. Bitcoin (BTC) 24h 7d 30d 1y All time It’s no secret that low liquidity leads to price swings, but Bitcoin dominance below 60% suggests an altcoin comeback. Despite hack noise and outflows, on-chain accumulation by whales and treasuries shows conviction. Fear & Greed at extremes, sentiment at rock bottom, usually mark capitulation before bounces. BTC Dominance, Tradingview ETF outflows likely peak as fear bottoms, clearing weak hands for fresh entries. With regulatory clarity improving and major treasuries still buying, the path higher remains intact for patient holders. Crypto cycles repeat, trust erodes on exploits, then rebuilds on scarcity and adoption. That’s why we call it a cycle, right? Follow us here for more updates. Discover: The best crypto to diversify your portfolio with The post Crypto News, June 9: Bitcoin Price Steady, Sam Bankman-Fried Formally Applies for a Trump Crypto Pardon as Humanity Exploited appeared first on Cryptonews .
9 Jun 2026, 08:34
Here’s why Cardano price has crashed and erased $84 billion in value

Cardano (ADA) price has crashed deeper than other altcoins this year, and is now hovering near its all-time low. It was trading at $0.1660 on Tuesday, down sharply from the record high of $3. This retreat has erased over $84 billion in value as the market cap has dropped from over $90 billion to $6 billion today. Cardano price has crashed amid ghost chain claims ADA price has been in a strong downward trend for a long time. After peaking at $3 in 2021, it has continued its strong crash, with all rebounds becoming good selling opportunities. The ongoing Cardano price crash is mostly because it has become a ghost chain who few people use. This is a big issue because Cardano was envisioned as the next big thing in the crypto industry. At some point, it was widely seen as the best alternative to Ethereum, a blockchain project that was once known for its slow speeds, high carbon emissions, and high transaction costs. Years later, Cardano has become a ghost chain. Developers have fled and users have largely abandone it. It has also been overtaken by other chains that launched years after Charles Hoskinson started it. A good example of this is in the decentralized finance (DeFi) industry, where Cardano has a total value locked (TVL) of less than $100 million. In contrast, Ethereum and Solana have billions of dollars in value. Cardano has just $35 million in stablecoin supply, a tiny amount in an industry with over $317 billion. It has no market share in the booming Real-World Asset (RWA) tokenization industry. As a result, data shows that the network is no longer making money. According to DeFi Llama, data shows that the network has made just $374,000 this year, a tiny amount for a crypto project worth over $6 billion. These metrics explain why no company has filed for a spot Cardano ETF despite its market capitalization. Efforts to save Cardano are not working There are signs that efforts to save Cardano are not working. For example, Charles Hoskinson and the team launched Midnight, a privacy-focused blockchain project. NIGHT, its token, saw its market capitalization jump to over $1.4 billion, a figure that has retreated to $533 million. There are signs that activity in Midnight has largely stalled and there are no major dApps in the ecosystem. Cardano also launched a major project to attract developers. For example, it launched a partnership with Pyth Network, a major player in the oracle space. Still, despite this, developers have not moved to the network. Cardano is also working on the Leios upgrade, which aims to make it a faster network by introducing parallel processing. Still, it is unclear whether developers will embrace the network ADA price technical analysis Cardano price chart | Source: TradingView The weekly chart shows that ADA price has crashed in the past few months. It formed a head-and-shoulders pattern, a common bearish reversal sign in technical analysis. The coin has slumped below all moving averages and is now hovering at the neckline. It has moved below the Ichimoku cloud indicator. Therefore, the token will likely continue falling in the near term. If this happens, the next key target to watch will be at $0.1500. The post Here’s why Cardano price has crashed and erased $84 billion in value appeared first on Invezz
9 Jun 2026, 08:30
Bitcoin Near $63.5K Is Hovering at What It Costs to Mine BTC, Leaving Miners at Break-Even
Bitcoin is changing hands near $63,500, a level analyst Charles Edwards says lines up with the network’s average production cost, i.e. the threshold where the typical miner stops turning a profit. Miners Squeezed to the Break-Even Line The recent selloff has dragged bitcoin back to a price band that has historically marked long-term value. In
9 Jun 2026, 08:29
Solana Price Prediction: SOL Holds $50-$81 Zone as Bulls Eye Recovery

Solana is back inside a major Fibonacci accumulation zone that previously came before a huge rally. Analysts now say the $50-$81 region must hold for SOL to build a recovery setup toward higher targets. Solana Re-Enters Historic Fibonacci Accumulation Zone That Previously Preceded a 2,200% Rally Solana (SOL) is trading inside a key Fibonacci retracement area that previously served as the foundation for one of its strongest bull-market advances. According to Crypto Patel, SOL has returned to the 0.5-0.618 Fibonacci retracement zone, an area that preceded a rally of more than 2,200% during the previous cycle. Solana Weekly Chart (SOL/USD). Source: Crypto Patel on X The chart highlights the current accumulation region between roughly $50 and $70, with SOL trading near the same Fibonacci levels that supported the market before its breakout in 2023. During that period, Solana spent months consolidating inside the zone before breaking above long-term resistance and beginning a major uptrend. According to the analysis, the current structure shares similarities with the previous setup. The chart shows SOL revisiting the 0.5 Fibonacci level near $70.30 and the 0.618 Fibonacci level near $50.02, both of which form the core of the highlighted accumulation zone. The chart also identifies several important levels above the market. Initial resistance sits near $98.60, while a larger resistance area appears around $297, where Solana previously struggled to maintain upward momentum. Beyond those levels, the analyst outlines a long-term scenario that could eventually target the $1,000 region if a new altcoin cycle develops. For now, the focus remains on whether buyers can continue defending the $50-$70 support area. While the historical comparison highlights similarities to the previous breakout setup, SOL remains below major resistance levels and has yet to confirm a new bullish trend. The current Fibonacci zone remains the key area traders are monitoring as the market searches for a longer-term direction. Solana Holds Critical Support Zone as Analyst Sees Recovery Potential Despite Broader Market Risks Solana (SOL) is trading near a major support area after a sharp market correction pushed the token back toward levels that previously acted as key turning points. According to analyst Hardy, SOL appears oversold and may be preparing for a recovery as long as broader market conditions remain stable. The monthly chart shows Solana consolidating near the $66-$81 range, an area highlighted as an important support zone. After falling from its recent highs, SOL has returned to levels that historically attracted buying interest during previous market cycles. Solana Monthly Chart (SOL/USDT). Source: Hardy on X According to the analysis, Bitcoin's recent decline and recovery, combined with rising Bitcoin dominance, could continue putting pressure on many altcoins. However, Hardy argues that Solana has already absorbed much of the recent weakness and is showing signs of stabilization compared with other assets. The chart also projects a potential recovery path if support continues to hold. Several upside targets are highlighted above the current price area, suggesting the analyst expects bullish momentum to gradually return if market conditions improve. The main downside risk remains a broader market deterioration led by Bitcoin. According to the analysis, a move toward the $33-$40 region represents a worst-case scenario for Solana, but such a decline would likely require a significant Bitcoin selloff and a much weaker overall crypto market environment. For now, the focus remains on the current support zone between roughly $66 and $81. As long as Solana holds this area, the chart continues to favor stabilization and a potential recovery attempt rather than an immediate move to lower levels.


