


 Invest ideas
News
24 May 2026, 16:00
FTX Lawyers Pay $54M In Settlement Over Services Rendered To Exchange – Details
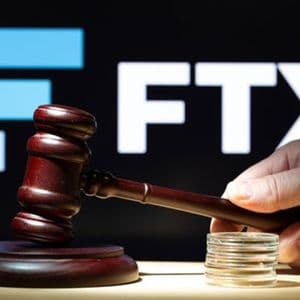
In a noteworthy development, US law firm Fenwick & West has agreed to pay $54 million to settle claims arising from its legal services for the defunct crypto exchange FTX. The proposed settlement, filed in federal court in Miami on Friday, resolves allegations from FTX customers who accused the Silicon Valley-based firm of facilitating misconduct tied to one of the largest financial frauds in US history. Fenwick Denies Knowledge Of FTX Illicit Activities Despite Settlement According to court filings as reported by Reuters, Fenwick & West served as a lead outside counsel for FTX during the exchange’s rapid expansion into a global crypto trading platform. Plaintiffs in the class action lawsuit alleged the firm “helped to craft and implement strategies that facilitated FTX’s fraud,” accusing the lawyers of assisting with regulatory and operational structures later tied to the misuse of customer funds. The proposed settlement agreement still requires approval from US District Judge K. Michael Moore in Miami. Attorneys representing FTX customers, including prominent litigator David Boies, argued the deal was reasonable and would prevent prolonged and costly litigation. However, Fenwick rejected allegations that it knowingly participated in fraudulent conduct. In a public statement, the law firm said it “was not aware of the fraud at FTX,” adding that it stood by the integrity of its legal work. The $54 million agreement marks the largest settlement in a second wave of FTX-related class action resolutions. Other settlements include an $11.75 million payment from former FTX auditor Prager Metis and a $420,000 settlement involving former Miami Heat player Udonis Haslem, who promoted the exchange. The Journey So Far FTX collapsed in November 2022 after revelations that an estimated $11- $13 billion in customer funds had allegedly been diverted to its sister trading firm, Alameda Research. The exchange’s bankruptcy triggered widespread panic across the digital asset market and erased $200 billion in global crypto market cap. In 2024, founder Sam Bankman-Fried was convicted on fraud and conspiracy charges and sentenced to 25 years in prison. Although he pleaded not guilty and has since appealed the conviction, claiming the initial trial was unfairly prejudiced against him. Meanwhile, the FTX Recovery Trust has continued efforts to reimburse affected creditors under the company’s Chapter 11 restructuring process. In March 2026, the estate announced a fourth distribution of approximately $2.2 billion, bringing cumulative repayments to eligible claimants close to $10 billion. Several customer classes, including many US-based users, have reportedly reached full or near-full recovery levels under the court-approved repayment plan.
24 May 2026, 15:59
ETH staking hits 39.1 million as price holds at $2,000

🚨 39.1 million ETH is now staked as $ETH stays at $2,000. Institutional demand for staking and tokenized assets remains high. Continue Reading: ETH staking hits 39.1 million as price holds at $2,000 The post ETH staking hits 39.1 million as price holds at $2,000 appeared first on COINTURK NEWS .
24 May 2026, 15:12
Dogecoin Price Analysis: DOGE Enters Final Stage of Multi Year Triangle

Dogecoin is moving deeper into a long term compression zone, with both price and market cap charts showing pressure near key resistance. DOGE still needs a confirmed breakout, but the narrowing structure shows that the next major move may be getting closer. Dogecoin Price Chart Shows Large Pennant as DOGE Compresses Dogecoin is moving inside a large long term pennant structure after its major impulse move, according to a chart shared by Bitcoinsensus on X. The chart shows DOGE forming lower highs and higher lows inside a narrowing triangle. This type of setup usually shows compression, where price moves into a smaller range before a larger move develops. DOGE Long Term Chart. Source: Bitcoinsensus on X The upper blue trendline has acted as resistance since the post rally peak. Each rejection from that line has kept DOGE inside the structure. A clean move above that trendline would be the first sign that buyers are trying to regain control. The lower blue trendline remains the key support area. DOGE has held that rising support several times since the 2022 low. If price loses that line, the pennant structure would weaken and the bullish setup would become less reliable. The chart also marks a possible path where DOGE breaks higher after one more pullback inside the pattern. However, the breakout still needs confirmation. Without a strong candle above resistance, DOGE may continue moving inside the narrowing range. For now, the main signal is compression. DOGE has not confirmed a breakout yet, but the long term chart shows price approaching the point where the pennant structure may decide the next larger move. Dogecoin Market Cap Chart Shows Breakout Pressure Near Apex Dogecoin market cap is compressing near the end of a long term triangle structure, according to a chart shared by DonWedge on X. The chart shows DOGE market cap moving under a descending resistance line that started after the 2021 peak. At the same time, a rising support line has held the lower side of the structure for several years. DOGE Market Cap Chart. Source: DonWedge on X This setup shows a tightening range. DOGE has not confirmed a breakout yet, but the chart suggests that pressure is building as price action moves closer to the triangle apex. A clean move above the yellow resistance line would be the first stronger bullish signal. The chart marks a possible upside target near $73.19 billion in market cap if buyers push DOGE out of the structure. However, DOGE still needs confirmation. Without a breakout above resistance, the market cap could continue moving sideways near the apex or retest the rising support line. The key risk sits at the lower purple trendline. If DOGE loses that support, the long term compression setup would weaken and the bullish breakout case would lose strength. For now, the chart shows DOGE holding inside a major multi year structure. The next larger move depends on whether buyers can break the descending resistance line with follow through.
24 May 2026, 15:08
Tom Lee’s Ethereum portfolio down $7.35B as ETH price outlook worsens

ETH’s bearish chart setup points to a 25% drop toward $1,600, risking over $10 billion in paper losses for BitMine in the coming weeks.
24 May 2026, 15:02
This Ripple Document States What Determines XRP Price

Crypto researcher SMQKE (@SMQKEDQG) is making a direct argument that XRP’s price is driven by hype but utility. A document by Ripple backs this claim. The document notes a specific economic structure that connects XRP’s value to real-world adoption of the Ripple protocol. The argument is worth examining closely. XRP has a fixed supply of 100 billion units . The protocol prohibits the creation of additional units. That supply constraint is absolute. According to SMQKE, what moves the price is demand tied to function rather than sentiment. XRP’s price is organically determined by utility. Not speculation. https://t.co/OQy7KVuOVJ — SMQKE (@SMQKEDQG) May 22, 2026 Two Functions Drive Demand Ripple Labs identified two core functions that give XRP organic demand. The first is network security, and the second is its role as a bridge currency. These are not marketing positions, but structural features of how the network operates. The network charges small fees denominated in XRP to prevent abuse. Without a cost attached to transactions, bad actors could flood Ripple servers with transaction spam or ledger spam. These denial-of-service attacks would render the network unable to process legitimate activity. XRP fees create an economic barrier against that abuse. Every user must also hold a minimum amount of XRP to maintain a valid account. The account reserve was 20 XRP. However, this has lowered over the years to boost accessibility as the asset grows. Trust line reserves and working order reserves each require 5 XRP. These amounts exist to make abusive transaction volumes expensive while remaining negligible for normal users. Less than $1 worth of XRP is sufficient to send tens of thousands of payments. XRP: The Bridge Currency Role XRP also functions as a bridge currency . When the Ripple protocol is used for cross-border payments, XRP can serve as an intermediate asset between two currencies that lack direct liquidity. As Ripple adoption grows, so does XRP’s utility in that role. We are on X, follow us to connect with us :- @TimesTabloid1 — TimesTabloid (@TimesTabloid1) June 15, 2025 This is the core of Ripple Labs’ business model. The company operates on the belief that wider adoption of the Ripple protocol will produce higher demand for XRP . Higher demand against a fixed supply triggers price appreciation. Organic Demand vs. Speculation SMQKE’s post addressed this directly. He described Ripple’s model as one where “increased adoption of the Ripple protocol is expected to translate into higher demand for XRP and long-term price appreciation.” The document reinforces this. It states that for there to be “long-term ‘organic’ demand (as opposed to purely speculative demand), XRP must provide some utility to its holders.” The document identifies security and bridge currency as the two mechanisms that deliver that utility. Disclaimer : This content is meant to inform and should not be considered financial advice. The views expressed in this article may include the author’s personal opinions and do not represent Times Tabloid’s opinion. Readers are advised to conduct thorough research before making any investment decisions. Any action taken by the reader is strictly at their own risk. Times Tabloid is not responsible for any financial losses. Follow us on X , Facebook , Telegram , and Google News The post This Ripple Document States What Determines XRP Price appeared first on Times Tabloid .
24 May 2026, 15:00
Bitcoin LTH Supply Surge Does Not Reflect Real Demand — Here’s Why

The price of Bitcoin seemed set for another round of pain over the weekend after falling below the psychological $75,000 level on Saturday morning. However, the premier cryptocurrency has somewhat recovered and is looking to reclaim $77,000 as of this writing. At the same time, an increase in the supply of Bitcoin’s long-term investors was also observed on the day, although the signal might not be what it seems. Here’s Why BTC LTH Supply Data Is Skewed In a recent post on the X platform, pseudonymous analyst Darkfost revealed a surge in the Bitcoin supply held by long-term holders (LTH) over the past few days. However, this supposed rise in LTH activity might not be as relevant to BTC’s growth as the data would ordinarily suggest. Related Reading: Bitcoin Bull Thesis Goes Big: 39 Trillion Reasons To Buy, Says Gemini Founder Highlighting data from CryptoQuant, Darkfost shared that the long-term holder supply has increased from 15 million to 15.8 million BTC over the past two days. The on-chain analyst noted that this metric is among the numerous data points affected by Coinbase’s movement of roughly 800,000 BTC in November 2025. Between November 22nd and 23rd, the US-domiciled crypto exchange shuffled 800,000 BTC (worth nearly $70 billion, at the time) between its internal wallets. As Darkfost mentioned, this maintenance transfer destroyed old LTH UTXOs (unspent transaction outputs) and created new but skewed Bitcoin datasets. The crypto analyst wrote on X: As a result, datasets across multiple platforms incorporated this movement, affecting UTXO-based metrics, age and value cohorts, STH/LTH cost basis, realized value, volumes, and more. Saturday, May 23rd marked six months since the Bitcoin transfer, with the moved BTC now fully transitioned from the short-term holder (STH) to the long-term holder supply. Typically, an increase in LTH supply signals increased accumulation and a growing conviction among the most seasoned crypto investors. However, market participants might want to exercise caution when making decisions with this on-chain signal, considering that it does truly reflect an increase in investor demand. What’s Next For Bitcoin Price? In a separate post on the X platform, Darkfost identified the next major resistance level for the Bitcoin price. Highlighting the STH cost basis, the analyst said that this resistance currently sits just above the $80,000 mark. According to Darkfost, the short-term investors seem to be choosing to cut their losses rather than holding for a reversal, as evidenced by resistance the Bitcoin price faces at their average cost basis. Hence, the premier cryptocurrency needs a sustained break above the $80,000 ceiling for its recovery journey to continue. As of this writing, BTC is valued at around $76,490, reflecting a 1% price increase in the past 24 hours. Related Reading: What The Bitcoin Transaction Volume Crashing Could Do To The Price Featured image from iStock, chart from TradingView


