


News
22 May 2026, 14:10
Swiss Franc Faces Heightened Risk Against Euro as ECB Doubts Mount, ING Warns

BitcoinWorld Swiss Franc Faces Heightened Risk Against Euro as ECB Doubts Mount, ING Warns Analysts at ING have flagged a shift in risk dynamics for the Swiss Franc (CHF) against the Euro (EUR), warning that growing uncertainty surrounding the European Central Bank’s (ECB) policy path is tilting the balance in favor of further CHF weakness. The assessment, published this week, points to a confluence of factors that could challenge the traditional safe-haven status of the Swiss currency in the near term. ECB Policy Uncertainty Fuels Risk Reassessment The core of ING’s analysis centers on the ECB’s increasingly unclear monetary policy direction. With inflation in the Eurozone proving stickier than anticipated in some sectors, while economic growth remains sluggish, the central bank faces a delicate balancing act. Markets are pricing in a potential pause or even a rate cut later in the year, but the timing and magnitude remain highly speculative. This ambiguity, ING argues, creates a volatile environment where the Euro is vulnerable to sharp moves, but the Swiss Franc is not necessarily the primary beneficiary. Historically, the Franc has strengthened during periods of Eurozone stress. However, ING notes that the current dynamic is different. The uncertainty is not solely about a crisis in the Eurozone, but rather about the ECB’s own credibility and forward guidance. This type of policy-driven doubt tends to benefit currencies with clearer central bank mandates, such as the Swiss National Bank (SNB), which has a more singular focus on price stability. Yet, the SNB’s own recent interventions and reluctance to let the Franc appreciate too rapidly are capping upside potential. Why the Risk is Tilted to the Downside for CHF ING’s report highlights several technical and fundamental factors supporting a bearish view on the Franc against the Euro. The EUR/CHF pair has been trading in a relatively narrow range, but the bias appears to be shifting. The analysts point to the SNB’s apparent comfort with a weaker Franc, as it supports the export-driven Swiss economy. Any move by the ECB to signal a more accommodative stance could trigger a risk-on rally, where investors move away from safe havens like the Franc and into higher-yielding assets, including the Euro. Furthermore, the relative interest rate differentials are not currently favoring the Franc. While the SNB has raised rates, the market is pricing in a peak that is lower than for the ECB. This means that if the ECB holds rates steady or cuts less aggressively than expected, the yield advantage could shift in favor of the Euro, making CHF-denominated assets less attractive. Market Implications for Forex Traders For currency traders and investors with exposure to the EUR/CHF pair, ING’s analysis suggests a tactical shift in strategy. The risk is no longer symmetrical; the potential for a sharp move higher in EUR/CHF (meaning a weaker Franc) is now considered greater than the risk of a sudden Franc strengthening. This has implications for hedging strategies, particularly for Swiss exporters who benefit from a weaker Franc, and for international investors holding Swiss bonds or equities. The key levels to watch are the recent trading ranges. A sustained break above the 0.9800 level for EUR/CHF could signal a more decisive move, with the next resistance around parity (1.0000). Conversely, a return to the 0.9500 area would indicate that the safe-haven bid is reasserting itself, but ING considers this a lower-probability scenario in the current environment. Conclusion ING’s latest analysis provides a clear and cautious outlook for the Swiss Franc, driven primarily by the fog surrounding ECB policy. While the Franc remains a long-term safe haven, the near-term risk is tilted towards further weakness against the Euro. Traders and investors should monitor ECB communications and Eurozone economic data closely, as any clarity on the rate path will be the primary catalyst for the next significant move in this pair. FAQs Q1: Why is ECB uncertainty affecting the Swiss Franc? The Swiss Franc is a traditional safe haven. When uncertainty rises in the Eurozone, investors often buy CHF. However, ING argues that the current uncertainty is about the ECB’s own policy direction, not a systemic crisis. This creates a different dynamic where the Franc may not strengthen as much, and could even weaken if the ECB’s actions are seen as supportive for the Euro. Q2: What does ‘risk tilted to the downside’ mean for CHF? It means that the probability of the Swiss Franc losing value against the Euro (EUR/CHF going up) is higher than the probability of it gaining value. This is a tactical call based on current market conditions and central bank policy expectations. Q3: How does the Swiss National Bank (SNB) influence this? The SNB has historically intervened to prevent the Franc from becoming too strong, as it hurts Swiss exports. Their current stance appears to tolerate a weaker Franc. This alignment with market dynamics (a weaker CHF) reinforces the view that the risk is tilted towards further Franc depreciation. This post Swiss Franc Faces Heightened Risk Against Euro as ECB Doubts Mount, ING Warns first appeared on BitcoinWorld .
22 May 2026, 14:05
British Pound Holds Ground Against Euro Despite Weak UK Retail Sales Data
BitcoinWorld British Pound Holds Ground Against Euro Despite Weak UK Retail Sales Data The British Pound has managed to hold its ground against the Euro this week, even as official data revealed a sharper-than-expected decline in UK retail sales for March. The resilience of sterling, trading near recent highs against the single currency, signals that currency markets are looking past short-term consumer weakness and focusing on broader macroeconomic divergence between the UK and the Eurozone. Retail Sales Disappoint, But Pound Holds Steady Data released by the Office for National Statistics on Friday showed UK retail sales volumes fell by 1.2% month-on-month in March, significantly worse than the 0.5% decline forecast by economists. The drop was driven by weaker spending in food stores and non-food retail, adding to concerns about consumer confidence amid persistent cost-of-living pressures. Despite the disappointing headline figure, the British Pound barely budged against the Euro, trading around 0.8550 EUR/GBP, a level not seen since early March. Analysts attributed the muted reaction to the fact that the data was largely backward-looking and that markets had already priced in a soft consumer environment. What Is Driving the Pound’s Resilience? Currency traders appear to be placing greater weight on interest rate expectations and inflation dynamics than on a single month’s retail sales print. The Bank of England has maintained a relatively hawkish stance, with markets pricing in a slower pace of rate cuts compared to the European Central Bank. The ECB, facing a weaker economic recovery in the Eurozone, has signaled more accommodative policy ahead, widening the rate differential in favor of sterling. Additionally, recent UK services sector data has remained resilient, and wage growth continues to run above pre-pandemic trends, providing underlying support for the Pound. These factors collectively outweigh the negative signal from retail sales, reinforcing the view that the UK economy, while sluggish, is not deteriorating as rapidly as some feared. Implications for Traders and Businesses For forex traders, the EUR/GBP pair remains a key barometer of relative economic health between the two regions. The Pound’s ability to shrug off weak data suggests the path of least resistance is still higher for sterling, at least in the near term. Businesses with exposure to cross-border trade between the UK and the Eurozone should monitor the pair closely, as further Pound strength could impact export competitiveness. Importers, on the other hand, may benefit from a stronger Pound if the trend continues. The next major test for the currency will come with the release of UK inflation data and the Bank of England’s next policy decision, both of which will provide clearer signals on the trajectory of interest rates. Conclusion The British Pound’s outperformance against the Euro, even in the face of disappointing UK retail sales data, underscores a market that is increasingly driven by central bank policy divergence rather than short-term economic prints. While consumer spending remains a concern, the broader macroeconomic narrative continues to favor sterling. Traders and businesses should remain attentive to upcoming data and policy signals, as the current resilience may be tested if the economic outlook deteriorates further. FAQs Q1: Why did the British Pound rise despite weak retail sales? The market focused on the Bank of England’s relatively hawkish stance compared to the ECB, as well as resilient services sector data and wage growth, which outweighed the negative retail sales report. Q2: What is the EUR/GBP exchange rate currently? The pair has been trading around 0.8550, with the Pound stronger than the Euro. Rates are subject to change based on market conditions and economic releases. Q3: How does this affect UK businesses? Exporters may face headwinds from a stronger Pound, while importers could benefit. Businesses with currency exposure should review hedging strategies in light of potential continued sterling strength. This post British Pound Holds Ground Against Euro Despite Weak UK Retail Sales Data first appeared on BitcoinWorld .
22 May 2026, 13:55
Indian Rupee Nears Record Low: RBI Steps Up Intervention, Says DBS
BitcoinWorld Indian Rupee Nears Record Low: RBI Steps Up Intervention, Says DBS The Indian rupee is trading dangerously close to its all-time low against the US dollar, prompting fresh action from the Reserve Bank of India (RBI). According to a recent analysis by DBS Bank, the central bank has intensified its intervention in the foreign exchange market to curb excessive volatility and prevent a disorderly slide in the currency. Rupee Under Pressure: Key Drivers The rupee’s weakness is driven by a confluence of global and domestic factors. A strong US dollar, fueled by resilient American economic data and delayed expectations of Federal Reserve rate cuts, has put emerging market currencies under widespread pressure. Additionally, rising crude oil prices, which increase India’s import bill, and persistent foreign portfolio outflows from Indian equities have added to the downward momentum. The USD/INR pair has been inching closer to the 84 mark, a level that market participants view as a critical psychological and technical support zone. RBI’s Intervention Strategy: What DBS Reports The DBS report highlights that the RBI has been actively selling US dollars through state-run banks to prevent the rupee from breaching its record low. The central bank’s approach is not to defend a specific level but to manage the pace of depreciation and prevent speculative attacks. By smoothing out sharp moves, the RBI aims to maintain orderly market conditions. The report notes that India’s foreign exchange reserves, though slightly depleted from their peak, remain robust at over $600 billion, providing ample firepower for sustained intervention if needed. Impact on Importers, Exporters, and Inflation A weaker rupee has a dual impact on the Indian economy. For import-dependent sectors such as oil, electronics, and machinery, the cost of raw materials and finished goods rises, potentially squeezing margins and fueling imported inflation. This can complicate the RBI’s monetary policy stance, as it may need to keep interest rates higher for longer to manage price pressures. Conversely, exporters in sectors like IT services, pharmaceuticals, and textiles benefit from a weaker currency, as their goods and services become more competitive in global markets. The net effect on the current account deficit depends on the elasticity of trade volumes. Market Outlook and Forward Guidance Analysts suggest that the rupee’s trajectory will largely depend on the US dollar’s strength and the RBI’s willingness to intervene. The DBS report expects the central bank to remain vigilant, especially around key resistance levels. Market participants are closely watching for any shift in the RBI’s communication or policy signals. In the near term, the rupee is likely to trade in a narrow range with a slight depreciation bias, barring any major external shock. The upcoming US inflation data and the Federal Reserve’s policy meeting will be critical events for the currency pair. Conclusion The Indian rupee’s journey toward its record low underscores the challenges facing emerging markets in a high-dollar environment. The RBI’s proactive intervention, as highlighted by DBS, provides a buffer against excessive volatility, but the fundamental pressures remain. For businesses and investors, understanding the interplay between global monetary policy, commodity prices, and central bank actions is essential for navigating the current landscape. The coming weeks will determine whether the rupee can stabilize or if further depreciation is in store. FAQs Q1: What is the current record low for the Indian rupee against the US dollar? The Indian rupee’s all-time low is near the 83.50-84.00 range against the US dollar, touched in late 2023 and early 2024. The exact level fluctuates with market conditions. Q2: How does the RBI intervene in the forex market? The RBI typically intervenes by selling US dollars from its reserves through authorized state-run banks. It can also use tools like adjusting interest rates, altering cash reserve ratios, or implementing administrative measures to influence capital flows. Q3: Will a weaker rupee lead to higher inflation in India? A weaker rupee increases the cost of imported goods, particularly crude oil, which can feed into higher domestic inflation. However, the impact is often gradual and depends on the extent of depreciation and the pass-through to consumer prices. The RBI closely monitors this risk in its monetary policy decisions. This post Indian Rupee Nears Record Low: RBI Steps Up Intervention, Says DBS first appeared on BitcoinWorld .
22 May 2026, 13:45
Euro Dips Below 1.1600 as Markets Eye Fed’s Warsh Swearing-In
BitcoinWorld Euro Dips Below 1.1600 as Markets Eye Fed’s Warsh Swearing-In The euro slipped below the 1.1600 mark against the U.S. dollar during early European trading on Wednesday, as currency markets turned their attention to the upcoming swearing-in ceremony of Federal Reserve Governor Christopher Warsh. The move reflects growing expectations that Warsh’s appointment could signal a more hawkish tilt at the central bank, potentially accelerating the timeline for interest rate adjustments. Market Context and Immediate Drivers The EUR/USD pair fell to 1.1585, its lowest level in two weeks, as traders priced in the possibility that Warsh, a known inflation hawk, may push for tighter monetary policy sooner than previously anticipated. The decline extended losses from the previous session, when the pair failed to hold above the 1.1650 resistance level. Analysts noted that the move was largely sentiment-driven, with no major economic data releases from either the eurozone or the United States to provide direction. What Warsh’s Appointment Means for the Fed Christopher Warsh, a former Fed governor who served from 2006 to 2011, is widely regarded as one of the more conservative voices on the Federal Open Market Committee. His swearing-in, scheduled for later this week, comes at a time when the Fed is grappling with persistently above-target inflation and a resilient labor market. Market participants are watching for any early signals from Warsh regarding his stance on the pace of rate hikes and the reduction of the central bank’s balance sheet. His presence could shift the committee’s internal balance toward a more aggressive tightening cycle. Implications for Forex Traders For currency traders, the immediate focus is on whether the euro can recover the 1.1600 level or if further downside is likely. Support is seen at 1.1550, a level that has held on multiple occasions over the past month. A break below that could open the door to a test of the 1.1500 psychological barrier. On the upside, resistance remains at 1.1650 and then 1.1700. The broader trend remains influenced by the interest rate differential between the Federal Reserve and the European Central Bank, with the ECB maintaining a more cautious approach to normalization. Conclusion The euro’s dip below 1.1600 underscores the market’s sensitivity to Federal Reserve personnel changes, even in the absence of concrete policy announcements. While the move may prove temporary, it highlights the underlying pressure on the euro as the U.S. central bank appears poised to maintain its tightening trajectory. Traders should monitor the swearing-in ceremony and any subsequent comments from Warsh for further directional cues. FAQs Q1: Why did the euro fall below 1.1600? The euro declined as markets anticipated that incoming Fed Governor Christopher Warsh, known for hawkish views, could push for faster interest rate hikes, strengthening the U.S. dollar. Q2: What is Christopher Warsh’s background? Warsh served as a Federal Reserve governor from 2006 to 2011 and is considered a conservative voice on monetary policy, often favoring tighter policy to combat inflation. Q3: What are the key levels to watch in EUR/USD? Immediate support is at 1.1550, with a break lower targeting 1.1500. Resistance stands at 1.1650 and 1.1700. This post Euro Dips Below 1.1600 as Markets Eye Fed’s Warsh Swearing-In first appeared on BitcoinWorld .
22 May 2026, 13:40
Bitcoin Price Prediction: Will BTC Stay Stuck in Consolidation Through the Weekend?
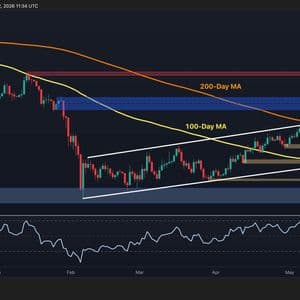
Bitcoin is trading at $77.3k to close out the week, locked in a consolidation that has now been running for nearly two weeks around the $75k–$80k range. The ascending channel from February is intact, the short-term support zone at $75k is holding, and the funding rates are positive again. This shows a market that is neither panicking nor rushing. What is building beneath the surface may matter more than what the price chart is showing. Bitcoin Price Analysis: The Daily Chart On the daily timeframe, the ascending channel continues to provide the macro framework, with the lower boundary rising toward $72k and the 100-day moving average also rising just above the same zone. These two dynamic support elements are located closely and create a strengthening combined floor that closes in on the price every week. The asset has held above the $75k demand zone after getting tested in the past week, and the RSI has stabilized around 50, neither building momentum nor losing it. The path forward requires a daily close above $80k and the declining 200-day moving average nearby, to build a bullish case again. Below, the support zone at $75k is the immediate support that could still get broken to the downside, which would then open the path toward the 100-day moving average and the lower boundary of the channel. Ultimately, a daily close below $72k would be a significant structural damage that could put the entire recovery case in jeopardy, and would put the $60 demand zone back in scope. BTC/USDT 4-Hour Chart On the 4-hour chart, the price has bounced from the $75k–$76k order block and is now consolidating directly below the recent structural lower high at $78.2k. The RSI on this timeframe has also recovered from near oversold levels that were reached during the recent sell-off to the mid-50s. This suggests that the bounce has legs without yet generating the momentum needed to clear the resistance above. The ascending daily channel’s structure is clean, with the floor located at $70k and the upper boundary is now around $83k, where the next critical resistance zone also sits. A 4-hour close above $78k would be the first confirmation that the price is rebounding, with the bearish Fair Value Gap zone around $80k as the next area to fill before targeting the channel’s ceiling. Yet, failure to clear $78k and a drop below $75k could lead to a further decline toward the key $72k area in the coming weeks. Sentiment Analysis The funding rates have returned to a modest +0.004 after oscillating between slightly negative and slightly positive for the past two weeks. The important development is not the current reading in isolation but what it represents in context. The deeply negative funding that powered the $60k to $80k recovery by providing constant short-squeeze fuel for every upward leg has been largely exhausted. The most recent negative bars have also been shallow, compared to the extremes of February and April. What this means practically is that the $75k support is holding without the assistance of forced short liquidations, driving the bounce. That is a more credible test of support than anything seen during the short-squeeze-dominated rally. The level is being defended by buyers who are choosing to buy, not by shorts being forced to cover. If funding oscillates near zero or remains modestly positive as price attempts to reclaim $80k, it would signal that organic long demand is beginning to replace short-squeeze mechanics as the driver, and historically, that transition has marked the point where recoveries become sustainable. Screenshot The post Bitcoin Price Prediction: Will BTC Stay Stuck in Consolidation Through the Weekend? appeared first on CryptoPotato .
22 May 2026, 13:35
Gold Faces Pullback Risk as Fed Policy Uncertainty Intensifies, Commerzbank Warns
BitcoinWorld Gold Faces Pullback Risk as Fed Policy Uncertainty Intensifies, Commerzbank Warns Gold prices, which have rallied sharply in recent months, now face an elevated risk of a pullback as the Federal Reserve’s policy outlook becomes increasingly uncertain, according to a new analysis from Commerzbank. The German bank’s commodities research team cautioned that shifting expectations for U.S. interest rates could trigger profit-taking and weigh on the precious metal in the near term. Fed Rate Expectations and Dollar Strength Drive the Outlook Commerzbank analysts point to a growing divergence between market pricing for Fed rate cuts and the central bank’s own cautious rhetoric. While futures markets have priced in multiple rate reductions for 2025, recent comments from Fed officials have pushed back against aggressive easing, citing persistent inflation and a resilient labor market. This disconnect creates a risk that rate cut expectations are repriced higher, strengthening the U.S. dollar and reducing gold’s appeal as an alternative asset. The bank notes that gold, which is priced in dollars, typically faces headwinds when the greenback appreciates. A stronger dollar makes gold more expensive for holders of other currencies, dampening demand. Additionally, higher-for-longer interest rates increase the opportunity cost of holding non-yielding assets like gold, further pressuring prices. Technical and Positioning Factors Add to Caution Beyond macroeconomic drivers, Commerzbank highlights that gold’s recent rally has left it technically extended. The metal has risen over 15% since the start of the year, approaching key resistance levels near $2,400 per ounce. Such rapid gains often invite profit-taking, especially if fundamental catalysts falter. Speculative positioning in the futures market also appears stretched. Data from the Commodity Futures Trading Commission shows that money managers hold a significant net long position in gold. A reversal in sentiment could trigger a wave of liquidation, accelerating a pullback. What This Means for Investors For investors holding gold as a portfolio hedge, the Commerzbank analysis serves as a reminder that even strong uptrends are punctuated by corrections. The bank does not predict a collapse in gold prices, but rather a healthy retracement that could offer better entry points later in the year. The key risk to monitor is the Fed’s messaging at the upcoming Federal Open Market Committee meeting, where any hawkish surprise could catalyze selling. Geopolitical tensions and central bank buying remain supportive long-term factors, but in the short term, monetary policy expectations are likely to dominate price action. Investors should prepare for increased volatility and consider adjusting position sizes accordingly. Conclusion Commerzbank’s warning highlights the growing tension between gold’s bullish fundamentals and the near-term headwinds posed by Fed policy uncertainty. While the long-term case for gold remains intact, the risk of a tactical pullback has increased. Investors would be wise to watch for shifts in rate expectations and dollar strength as key triggers for the next directional move in gold prices. FAQs Q1: Why does the Fed’s policy affect gold prices? A: Gold is a non-yielding asset, so when interest rates rise, the opportunity cost of holding gold increases. Additionally, higher rates typically strengthen the U.S. dollar, which makes gold more expensive for international buyers and can push prices lower. Q2: What level is Commerzbank watching for a potential gold pullback? A: The bank notes that gold has approached key resistance near $2,400 per ounce. A failure to break above this level, combined with hawkish Fed signals, could trigger a correction back toward the $2,200–$2,250 range in the near term. Q3: Is Commerzbank bearish on gold long-term? A: No. The bank’s analysis focuses on short-term pullback risk, not a long-term bearish view. Central bank buying, geopolitical uncertainty, and potential rate cuts later in the year remain supportive factors for gold over a longer horizon. This post Gold Faces Pullback Risk as Fed Policy Uncertainty Intensifies, Commerzbank Warns first appeared on BitcoinWorld .


