


 Invest ideas
News
22 May 2026, 12:55
BlackRock Transfers $122.6 Million in Bitcoin to Coinbase, Raising Market Questions

BitcoinWorld BlackRock Transfers $122.6 Million in Bitcoin to Coinbase, Raising Market Questions BlackRock, the world’s largest asset manager with over $10 trillion in assets under management, has deposited 1,587 Bitcoin (BTC), valued at approximately $122.55 million, and 17,815 Ether (ETH), worth around $37.79 million, to the Coinbase exchange, according to data from blockchain tracking firm Onchain Lens. The transfers, which occurred over the past 24 hours, have drawn immediate attention from market analysts, as large deposits to centralized exchanges are historically interpreted as a potential precursor to selling. Understanding the Significance of Exchange Inflows In the world of cryptocurrency, movements of significant funds from private wallets to exchange platforms are closely monitored. The logic is straightforward: investors typically move assets to exchanges when they intend to sell or trade them. While a deposit does not guarantee an immediate sale, it increases the available supply on the order book, which can create downward price pressure. BlackRock’s actions are particularly noteworthy given its outsized role in the digital asset space. The firm is the issuer of the iShares Bitcoin Trust (IBIT), the largest spot Bitcoin exchange-traded fund (ETF) in the United States. Since its launch in January 2024, IBIT has accumulated over $50 billion in Bitcoin holdings, making BlackRock a dominant force in the institutional crypto market. These specific transfers come from wallets that are part of BlackRock’s broader on-chain activity. The timing of the deposit coincides with a period of relative price consolidation for Bitcoin, which has been trading in a range between $95,000 and $105,000. The broader market is also digesting recent macroeconomic data, including U.S. inflation figures and Federal Reserve interest rate decisions. Market Implications and Institutional Behavior The immediate market reaction to the news has been muted, with Bitcoin’s price showing minimal volatility. However, analysts caution that large institutional moves can have a delayed impact. The Ethereum portion of the transfer, valued at $37.79 million, also adds to the narrative of institutional diversification beyond Bitcoin. It is important to note that not all exchange deposits are sell orders. Institutions frequently use exchanges for custody, collateral management, or operational liquidity. BlackRock itself has stated in previous filings that it may lend or otherwise use its Bitcoin holdings to generate yield. Therefore, while the deposit raises the possibility of a sale, it is not a definitive signal. This event also highlights the growing transparency of on-chain data. Platforms like Onchain Lens, Arkham Intelligence, and Glassnode allow the public to track wallet activity associated with major entities. This transparency is a double-edged sword: it provides valuable market intelligence but can also lead to misinterpretation of routine operational moves. Why This Matters for the Average Investor For retail investors, understanding the behavior of large holders, often called ‘whales,’ is crucial for navigating market sentiment. Large deposits can signal a potential top, while large withdrawals to private wallets can indicate accumulation. However, the complexity of institutional operations means that retail investors should avoid making impulsive decisions based on single data points. The key takeaway is that institutional involvement in crypto is maturing. BlackRock’s movements, whether for trading, custody, or yield generation, are now part of the normal market infrastructure. This maturity brings both stability and new layers of complexity. Conclusion BlackRock’s $122.6 million Bitcoin deposit to Coinbase is a significant data point that warrants attention but not panic. It reflects the ongoing integration of digital assets into mainstream finance. While the move could precede selling, it may equally represent routine operational activity. The event underscores the importance of on-chain monitoring for market participants and reinforces the need for context-driven analysis rather than reactionary trading. As the institutional crypto ecosystem evolves, such transfers will likely become more frequent, and the market will need to adapt to a new baseline of large-scale liquidity management. FAQs Q1: Does a large deposit to an exchange always mean the asset will be sold? No. While a deposit to an exchange increases the potential for selling, institutions also use exchanges for custody, collateral, and operational liquidity. A deposit is a necessary step for selling, but it is not a guarantee that a sale will occur. Q2: How does BlackRock’s Bitcoin ETF (IBIT) relate to these on-chain transfers? BlackRock’s IBIT ETF holds Bitcoin on behalf of its investors. The on-chain transfers to Coinbase could be related to the ETF’s operations, such as rebalancing, meeting redemption requests, or managing custody arrangements. The exact purpose is not always disclosed publicly. Q3: Should I sell my Bitcoin because of this news? No. This single data point should not be the basis for an investment decision. Market movements are influenced by a wide range of factors, including macroeconomic conditions, regulatory developments, and overall market sentiment. It is always advisable to conduct your own research or consult with a financial advisor. This post BlackRock Transfers $122.6 Million in Bitcoin to Coinbase, Raising Market Questions first appeared on BitcoinWorld .
22 May 2026, 12:50
Whales Accumulate 525 Million DOGE in Four Days as Dogecoin Tests Key Moving Average
BitcoinWorld Whales Accumulate 525 Million DOGE in Four Days as Dogecoin Tests Key Moving Average Large-scale investors, commonly referred to as whales, have accumulated approximately 525 million Dogecoin (DOGE) over the past four days, according to data from Santiment reported by crypto analyst Ali Martinez. The accumulation comes as Dogecoin’s price tests its 200-day moving average (MA) of $0.117, a critical technical level that often signals long-term trend direction. Whale Activity and Retail Sell-Offs Analysis from U.today indicates that DOGE is forming a pattern of higher lows just below the 200-day MA, a development that typically suggests buying pressure. The data points to whales absorbing sell-offs from retail investors, who may be exiting positions amid recent price volatility. This dynamic is often interpreted as a sign of confidence among large holders in the asset’s medium-term prospects. Absence of Institutional Inflows Notably, the recent whale accumulation has not been mirrored by inflows into U.S. spot Dogecoin exchange-traded funds (ETFs). This divergence suggests that the buying activity is concentrated among private large holders rather than institutional investors using regulated fund products. The lack of ETF inflows may indicate that institutional sentiment remains cautious, even as private whales increase their exposure. Technical Outlook and Key Levels The 200-day moving average is a widely watched indicator in financial markets, representing the average closing price over the last 200 trading days. A sustained break above this level could signal a shift in market sentiment and potentially attract further buying interest. Conversely, failure to break above the 200-day MA risks trapping DOGE within its current price range, prolonging the consolidation phase that has characterized recent trading. Long-Term Catalysts and Real-World Integration Beyond technical factors, the long-term trajectory for Dogecoin may depend on real-world economic integration. Analysts have pointed to potential use cases through platforms such as X (formerly Twitter) and its financial application, X Money. Integration into a mainstream payment ecosystem could provide a fundamental demand driver, moving Dogecoin beyond speculative trading into practical utility. However, such developments remain unconfirmed and speculative at this stage. Conclusion The accumulation of 525 million DOGE by whales over four days highlights a divergence in market behavior between large private holders and institutional investors. While the test of the 200-day moving average presents a technically significant moment, the absence of ETF inflows and reliance on future integration into platforms like X Money introduce uncertainty. Traders and investors should monitor whether DOGE can establish a clear break above $0.117, as this would likely determine the token’s direction in the coming weeks. FAQs Q1: What is the significance of the 200-day moving average for Dogecoin? The 200-day moving average is a key technical indicator used to assess the long-term trend of an asset. A price above this level is often seen as bullish, while a price below it can indicate bearish sentiment. For Dogecoin, breaking above $0.117 could signal a potential trend reversal. Q2: Why are whales buying Dogecoin while retail investors sell? Whales, or large holders, often have longer investment horizons and may view current price levels as a buying opportunity. Retail investors may be reacting to short-term volatility or uncertainty. This divergence can indicate that large holders are accumulating during a dip, which sometimes precedes a price recovery. Q3: What does the lack of DOGE ETF inflows mean? The absence of inflows into U.S. spot Dogecoin ETFs suggests that institutional investors are not participating in the current accumulation phase. This could reflect cautious sentiment among regulated fund managers, who may require more clarity on regulatory or adoption catalysts before increasing exposure. This post Whales Accumulate 525 Million DOGE in Four Days as Dogecoin Tests Key Moving Average first appeared on BitcoinWorld .
22 May 2026, 12:48
OKX and ICE are bringing 'never-expiring' oil futures to 120 million crypto users

The new partnership comes as Hyperliquid’s oli futures contracts that never expire have been a huge success with over $1.6 billion in 24-hour trading volume.
22 May 2026, 12:45
Gold Holds Steady Within Weekly Range as Traders Eye US-Iran Talks
BitcoinWorld Gold Holds Steady Within Weekly Range as Traders Eye US-Iran Talks Gold prices remained locked in a tight weekly range on Tuesday as traders weighed the potential outcome of ongoing US-Iran nuclear negotiations. The precious metal has struggled to break decisively above resistance or below support, reflecting a market caught between geopolitical uncertainty and a relatively steady US dollar. Geopolitical Crosscurrents Keep Gold Range-Bound Spot gold hovered near $2,330 per ounce in European trading, staying within the $2,310–$2,350 band that has held since last week. The lack of a clear breakout stems from conflicting signals: on one hand, the prospect of a diplomatic breakthrough between Washington and Tehran could reduce safe-haven demand. On the other, any breakdown in talks or renewed tensions would likely drive investors back into gold. Analysts at several major banks have noted that the market is pricing in a roughly 40% probability of a partial agreement, which would ease sanctions on Iranian oil exports in exchange for nuclear restrictions. Such an outcome could temporarily weigh on gold by reducing geopolitical risk premiums. Technical Levels and Market Sentiment From a technical perspective, gold has established clear support at $2,310, a level reinforced by the 50-day moving average. Resistance at $2,350 has capped rallies three times in the past week. A sustained move above that level could open the door to $2,380, while a break below $2,310 might trigger a test of the $2,280 region. Trading volumes have been below average, suggesting institutional investors are waiting for a clearer catalyst. The CME FedWatch Tool shows a 70% probability of a rate cut in September, which could provide medium-term support for gold by lowering the opportunity cost of holding non-yielding assets. Why This Matters for Investors For retail and institutional investors alike, the current range-bound action in gold offers a window to reassess portfolio exposure. A resolution in US-Iran talks could reduce near-term safe-haven demand, but persistent inflation concerns and central bank gold purchases remain supportive factors. The key question is whether the market has already priced in a diplomatic outcome or if a surprise — positive or negative — could spark the next major move. Conclusion Gold’s inability to escape its weekly range reflects a market in wait-and-see mode. With US-Iran talks as the primary near-term driver, traders should monitor headlines closely for any shift in tone. A clear diplomatic breakthrough could push gold toward the lower end of its range, while a collapse in negotiations would likely reignite safe-haven buying. Until then, range trading strategies may offer the best risk-reward balance. FAQs Q1: Why is gold stuck in a range despite geopolitical tensions? Gold is range-bound because the market is uncertain about the outcome of US-Iran talks. A diplomatic deal could reduce safe-haven demand, while a breakdown could increase it. This uncertainty keeps prices balanced between support and resistance levels. Q2: What are the key technical levels to watch for gold? Support is at $2,310, with stronger support near $2,280. Resistance is at $2,350, and a breakout above that could target $2,380. Traders should watch for volume confirmation on any breakout. Q3: How do US-Iran talks affect gold prices? US-Iran talks directly impact gold’s safe-haven premium. Progress toward a deal reduces geopolitical risk, potentially lowering gold prices. Stalled or failed talks increase uncertainty, driving demand for gold as a hedge against instability. This post Gold Holds Steady Within Weekly Range as Traders Eye US-Iran Talks first appeared on BitcoinWorld .
22 May 2026, 12:38
Signs of Life in XRP? 4,300 New Wallets in 24 Hours & Whale-Sized Exchange Outflows Illustrate a Possible Shift

Is XRP’s On-Chain Surge the Icing on the Breakout Cake? XRP is starting to show on-chain signals that are often associated with the early phase of a broader market reversal. According to blockchain analytics platform Santiment Intelligence, XRP saw 4,300 new wallets created within 24 hours, the fourth-largest spike recorded in 2026. Historically, sharp increases in wallet creation tend to reflect fresh inflows of interest and capital before price action fully responds, making it a closely watched leading indicator for network-driven momentum. Despite this surge in activity, XRP has remained stuck in a relatively tight trading range. Why is this disconnect important? Well, analysts usually see rising network participation and muted price movement as a potential stepping stone towards breakout setups, especially when growth metrics begin accelerating ahead of market expansion. XRP Whales Are Quietly Loading Up as Exchange Supply Continues to Shrink Interestingly, whale activity is reinforcing the above narrative. Market analyst Xaif Crypto notes that 57.6% of all XRP leaving Binance consists of transfers above 1 million XRP. Large exchange outflows of this size are typically interpreted as accumulation, as major holders tend to move assets off exchanges when positioning for longer-term holding rather than immediate selling. This pattern isn’t limited to Binance. Data linked to Coinbase also shows steady outflows from large holders, suggesting a broader trend of reduced exchange balances across major trading platforms. When combined with rising whale accumulation, shrinking reserves can tighten available sell-side liquidity, a condition that has historically preceded stronger upward moves when demand returns. On the macro front, something intriguing is happening because even as the broader crypto market faced risk-off pressure tied to geopolitical uncertainty, XRP still recorded $67.6 million in inflows while digital asset investment products saw roughly $1.07 billion in outflows. This divergence has fueled speculation that larger investors may already be positioning ahead of a potential shift in momentum. Per CoinCodex, XRP is currently trading at $1.36. While price action remains quiet for now, the combination of accelerating wallet growth, sustained whale outflows from exchanges, and improving relative inflows is the kind of setup that should be watched closely when assessing early-stage trend reversals.
22 May 2026, 12:17
Bitcoin Stalls Near $77K as ETF Outflows Hit $1.15B, NEAR Surges 28%, HYPE Prints ATH
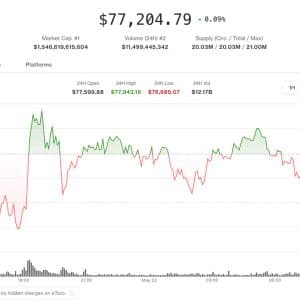
Bitcoin News Bitcoin has settled into a tight holding pattern, trading near $77,200 and showing little net change over the past 24 hours or across the trailing week. The largest digital asset has b...


